Custom widget
-
Many thnks for the great explanation!!
I setup the example and played around with it and it works fine in chrome on my PC, however on my chrome book and phone, the graph stays empty...In both non working browsers, javascript is enabled and the example shown here http://jsfiddle.net/berni/Yb4d7/ works in both browsers.
any idea what could be the issue here?
-
@Tag Have you refreshed your browser in your chrome book and on your phone(F5) and clear cache. If it is not working till, can see any error on console?
-
YEAY!! victory, clearing all cache and refresh worked on the chrome book
thanks!
-
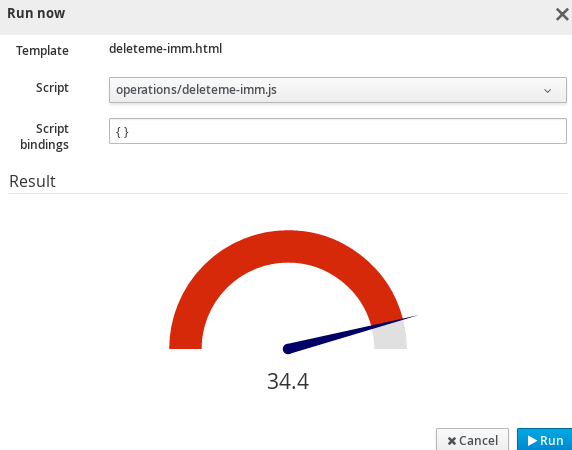
This HTML script will give you a gauge that will change color based on the value of the scale in percentage.
The script below has a scale range 0-5000. (I use it to measure my KWH usage)....Here is the trick i experimented with
limitMax: 'false',
  percentColors: [[0.0, "#a9d70b" ], [0.80, "#f9c802"], [1.0, "#ff0000"]], // !!!!
  strokeColor: '#b0b0b0',
    generateGradient: true
From 0% - 80% the scale is green to yellow at the 80%, the from 80%-100% it will rapidly change to red....
Green: #a9d70b
Orange #f9c802
Red #ff0000
I also made the value font, bold by adding this ; font-weight:bold
And with this line you can set the maximum value of the gauge gauge.maxValue = 5000; lower it to something that comes close to the max value you want to measure.
Really nice effect!
-------------- Cut ----------------
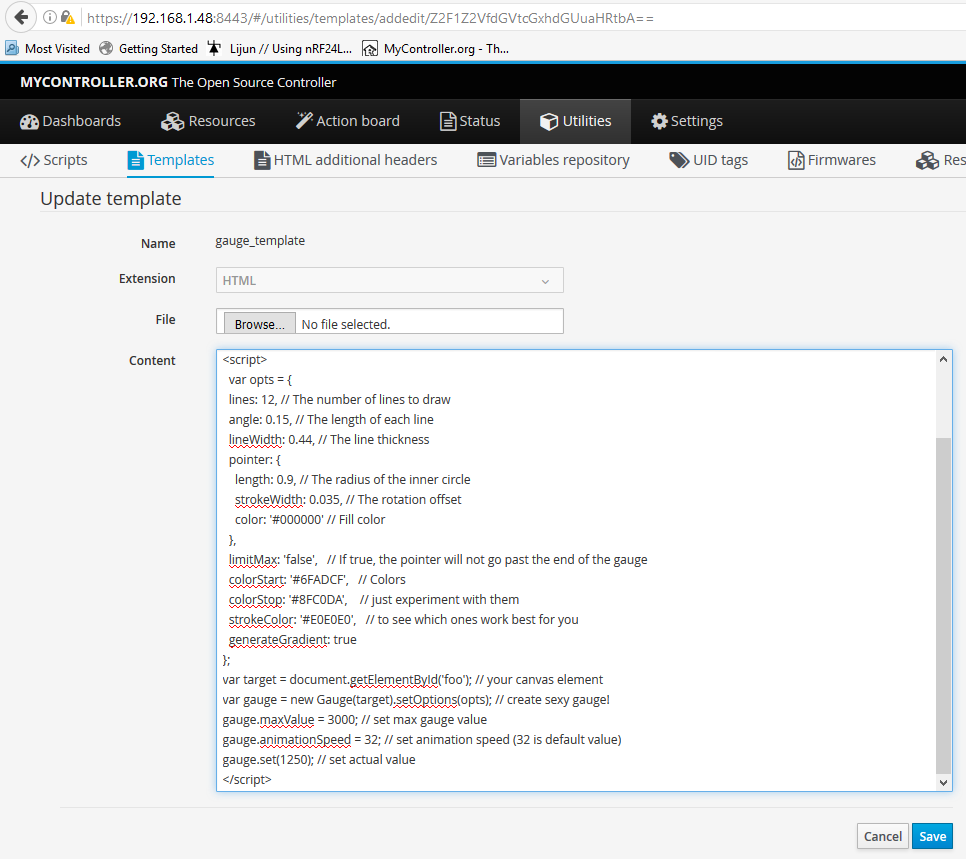
<div id="wrapper" style="text-align: center">
  <canvas id="my-gauge-${uuid}" style="display: inline-block;"></canvas>
  <div style="font-size:21px ; font-weight:bold" id="textfield--${uuid}"></div>
</div>
<script>
  var opts = {
      lines: 12,
  angle: 0.05,
  lineWidth: 0.44,
  pointer: {
    length: 0.9,
    strokeWidth: 0.035,
    color: '#303030'
    },
limitMax: 'false',
  percentColors: [[0.0, "#a9d70b" ], [0.80, "#f9c802"], [1.0, "#ff0000"]], // !!!!
  strokeColor: '#b0b0b0',
    generateGradient: true
  };
  var target = document.getElementById('my-gauge-${uuid}'); // your canvas element
  var gauge = new Gauge(target).setOptions(opts); // create sexy gauge!
  gauge.animationSpeed = 3; // set animation speed (32 is default value)
  gauge.maxValue = 5000; //Maximum value
  gauge.setTextField(document.getElementById("textfield--${uuid}"));
  gauge.set(${temperatureSen.value}); // set actual value
</script>

<!--see http://jsfiddle.net/berni/Yb4d7/ for example-->
-------------- Cut ----------------
-
Thanks for showing this. It makes it very versatile. However for the Temperature example above, how do I get all decimals? I'd like the Temperature to show for example "23.45°C"
///Redferne
-
how do I get all decimals? I'd like the Temperature to show for example "23.45°C"
I guess it is limitation of http://bernii.github.io/gauge.js/dist/gauge.min.js or we may have some option to show decimal points. Kindly refer http://bernii.github.io/gauge.js
-
Nope, Gauge handles decimals and negative values just fine. See here:
http://jsfiddle.net/berni/smNjl/ -
Can you try this line
gauge.set(${temperatureSen.value}); // set actual valuewith this,
gauge.set(parseFloat(${temperatureSen.value})); // set actual value -
@jkandasa said:
gauge.set(parseFloat(${temperatureSen.value}));
Solution was little more complicated:
<div id="wrapper" style="text-align: center"> <canvas id="my-gauge-${uuid}" style="display: inline-block;"></canvas> <div style="font-size:21px" id="textfield--${uuid}"></div> </div> <script> var CustomTextRenderer = function(el){ this.el = el; this.render = function(gauge) { this.el.innerHTML = gauge.displayedValue.toPrecision(3); } } CustomTextRenderer.prototype = new TextRenderer(); var cs = new CustomTextRenderer(document.getElementById("textfield--${uuid}")); var opts = { lines: 32, angle: 0, lineWidth: 0.24, pointer: { length: 0.9, strokeWidth: 0.035, color: '#000066' }, limitMax: 'false', percentColors: [[0.0, "#2B31CF" ], [0.60, "#37CF32"], [1.0, "#ff0000"]], strokeColor: '#E0E0E0', generateGradient: true }; var target = document.getElementById('my-gauge-${uuid}'); var gauge = new Gauge(target).setOptions(opts); gauge.animationSpeed = 3; gauge.maxValue = 40.0; gauge.setMinValue(-30.0); gauge.setTextField(new CustomTextRenderer(document.getElementById("textfield--${uuid}"))) gauge.set(${temperatureSen.value}); </script> -
Hi all,
Brilliant program @jkandasa , I'm having some issues with the gauge display, I don't see the gauge when I test the template. I'm using Firefox, cleared the history and cache. even tried it with Microsoft Edge, but my gauge does not display. Rebooted the RaspBerry PI as well, I don't see any errors in the logs etc, could someone point me in the right direction please, see screenshots below
Regards
-
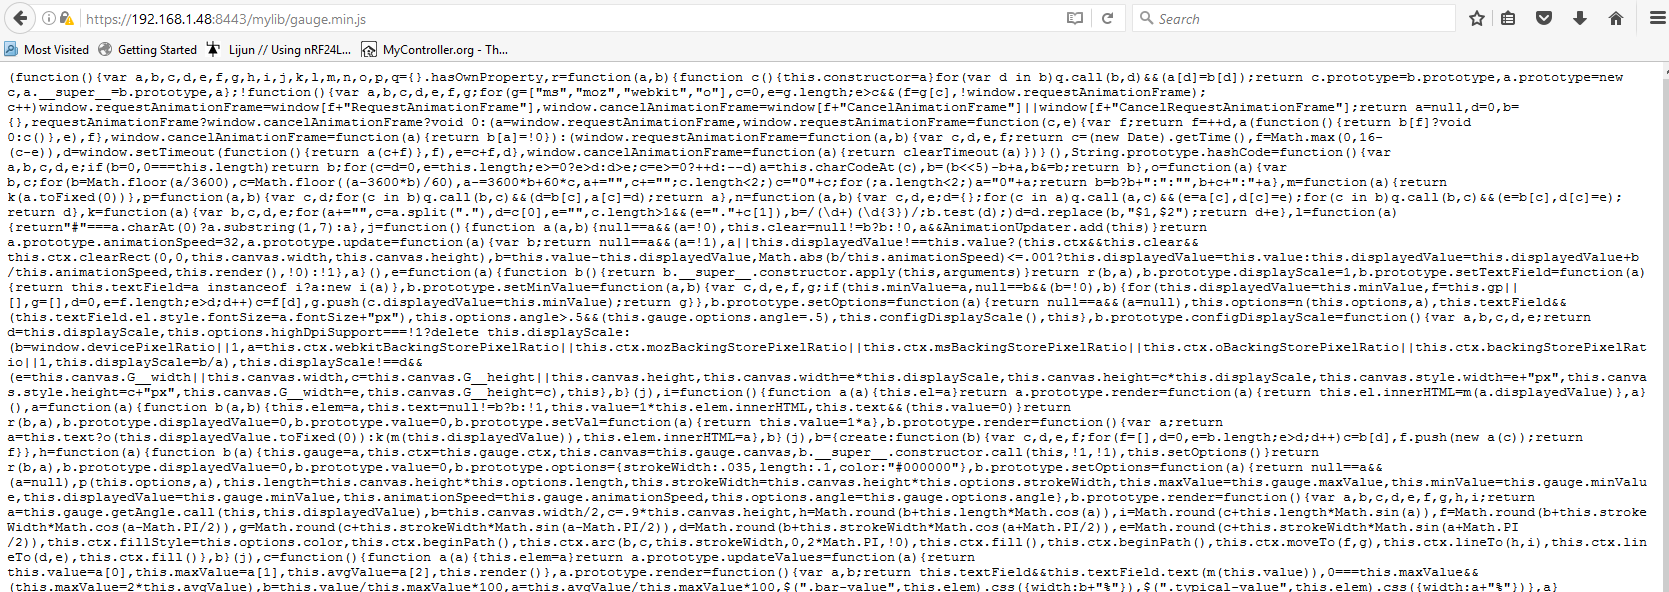
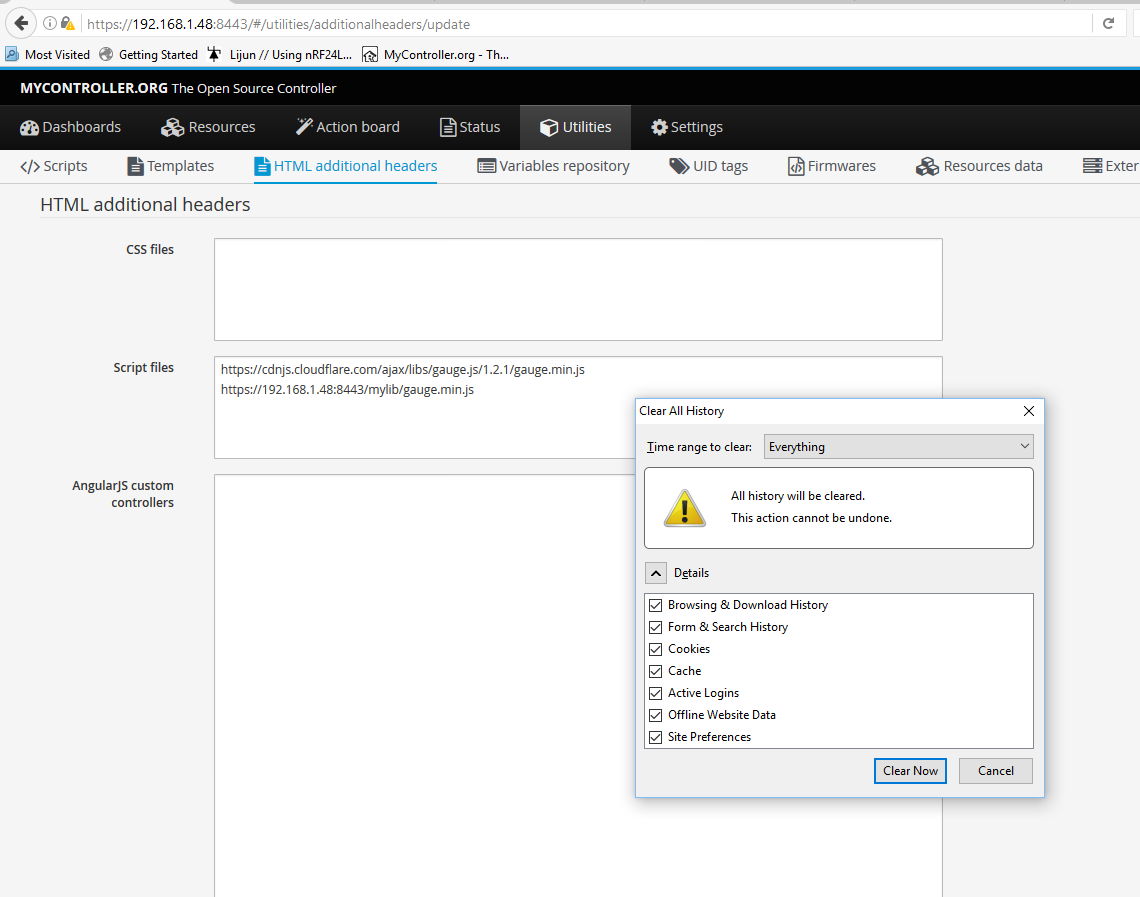
The location of the gauge.min.js
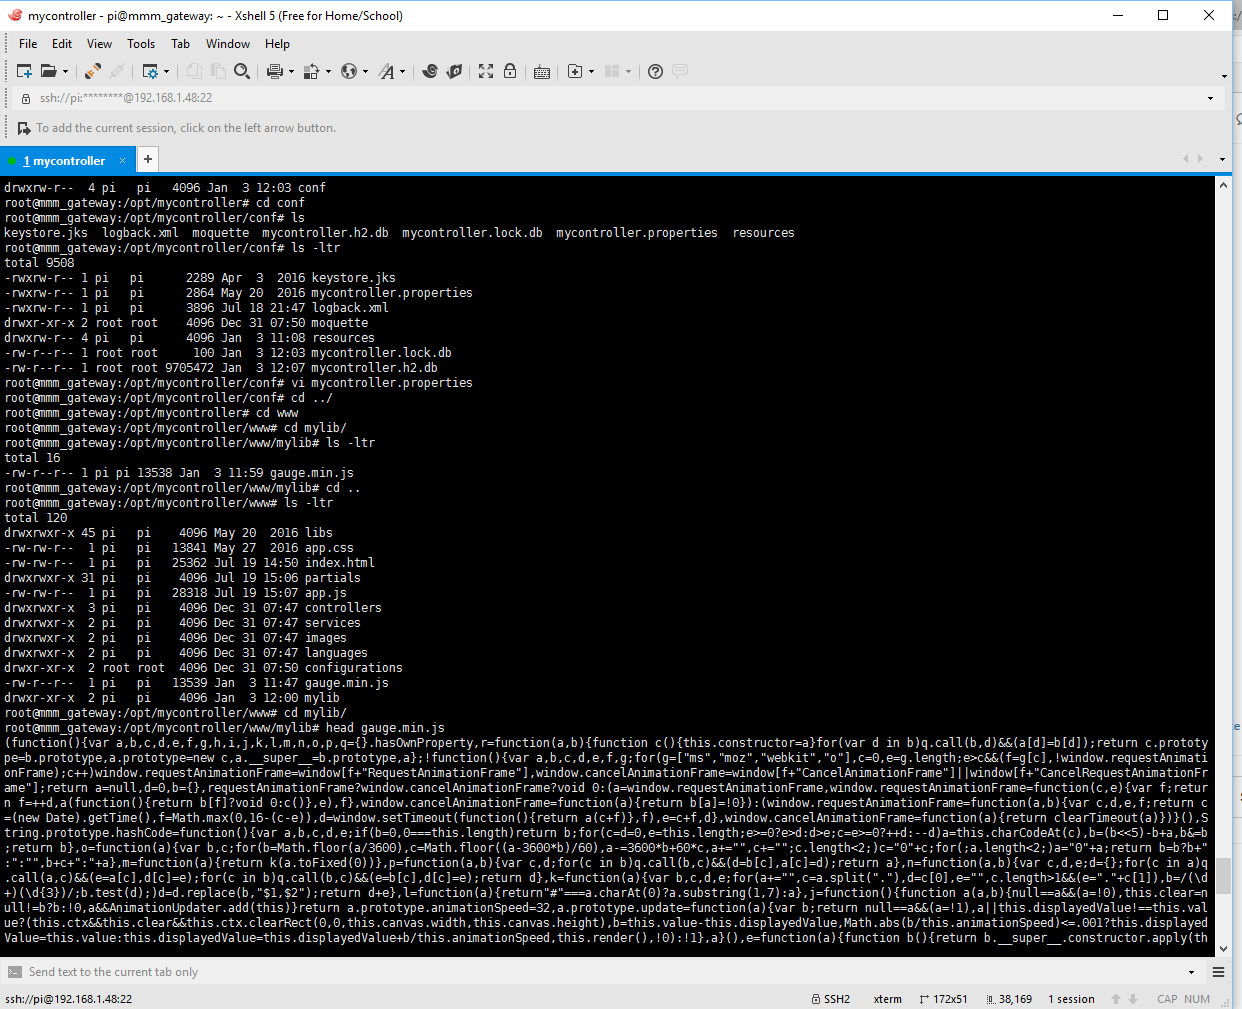
-
@esawyja You have to add
gauge.min.jsas mentioned here,
.
Once done, reload your browser.
-
Hi
Sorry yes I did, I just forgot to include the screenshot, still not seeing the gauge, any other suggestions please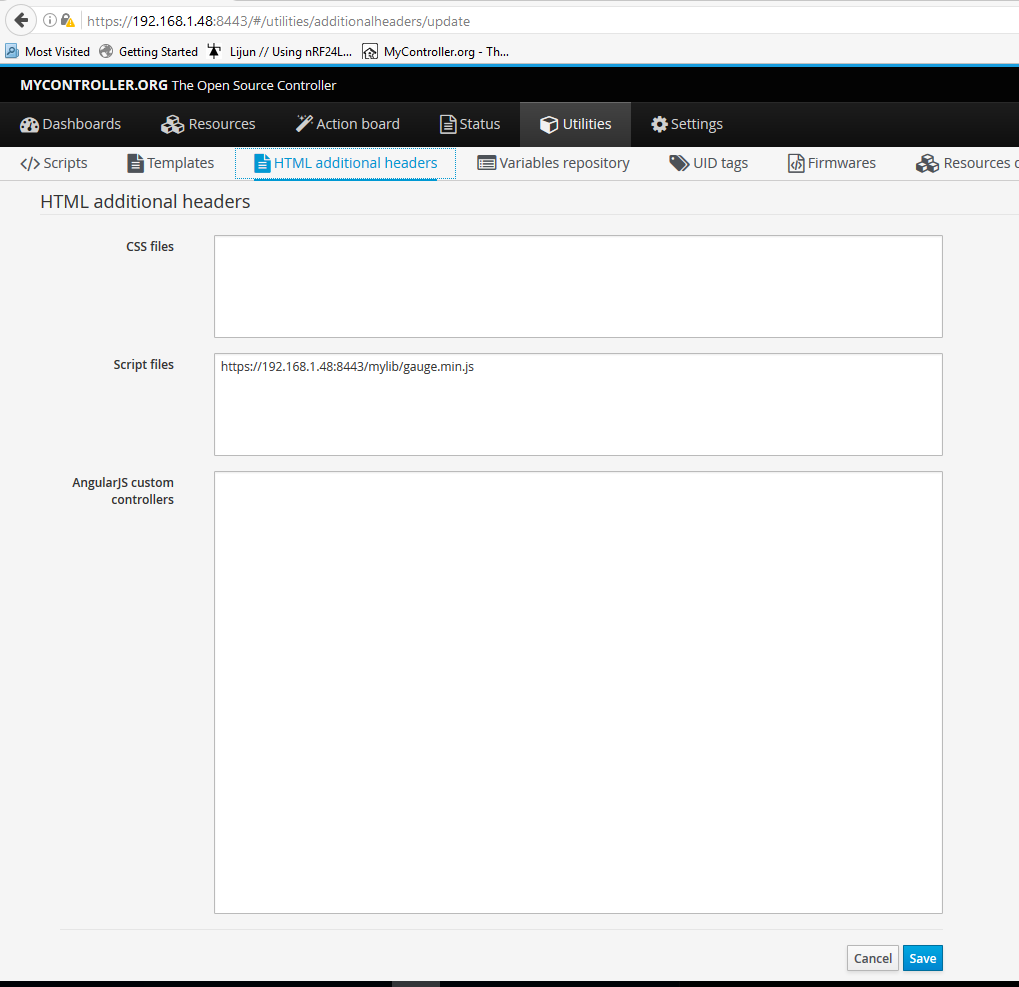
-
@esawyja can you post your gauge HTML template and javaScript code?
-
Sure, see below
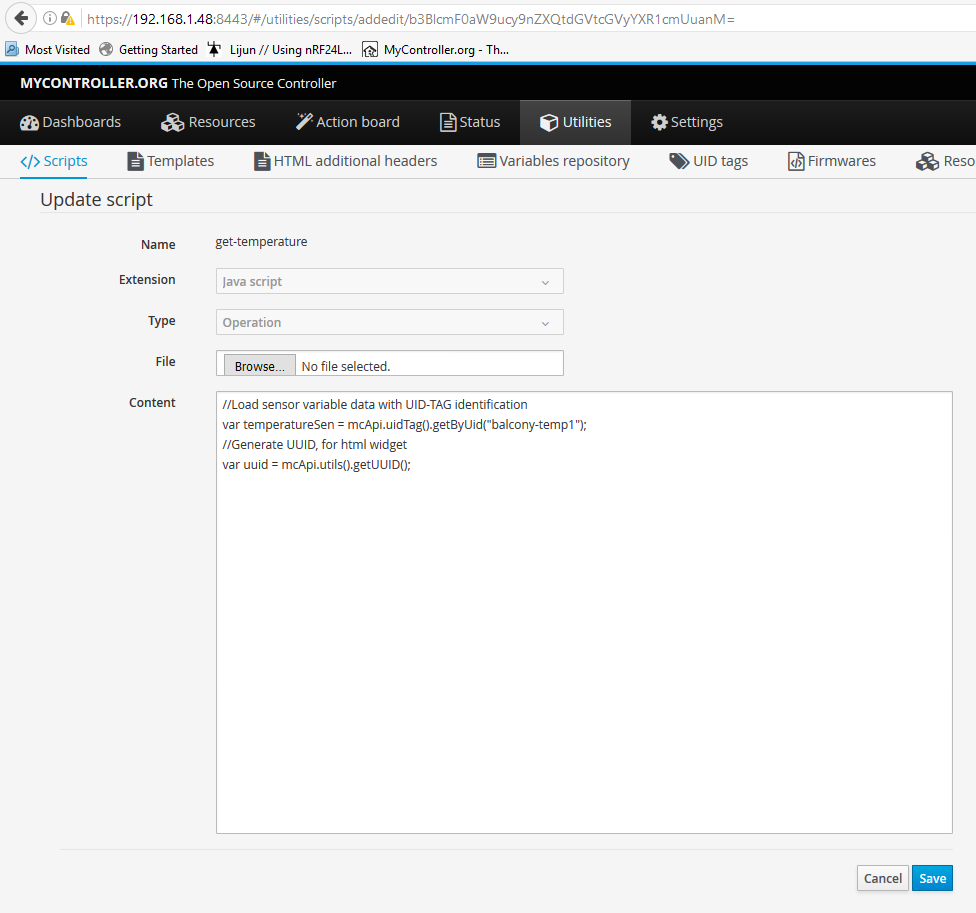
Below is the template file
<div id="wrapper" style="text-align: center"> <canvas id="my-gauge-${uuid}" style="display: inline-block;"></canvas> <div style="font-size:21px" id="textfield--${uuid}"></div> </div> <script> var CustomTextRenderer = function(el){ this.el = el; this.render = function(gauge) { this.el.innerHTML = gauge.displayedValue.toPrecision(3); } } CustomTextRenderer.prototype = new TextRenderer(); var cs = new CustomTextRenderer(document.getElementById("textfield--${uuid}")); var opts = { lines: 32, angle: 0, lineWidth: 0.24, pointer: { length: 0.9, strokeWidth: 0.035, color: '#000066' }, limitMax: 'false', percentColors: [[0.0, "#2B31CF" ], [0.60, "#37CF32"], [1.0, "#ff0000"]], strokeColor: '#E0E0E0', generateGradient: true }; var target = document.getElementById('my-gauge-${uuid}'); var gauge = new Gauge(target).setOptions(opts); gauge.animationSpeed = 3; gauge.maxValue = 40.0; gauge.setMinValue(-30.0); gauge.setTextField(new CustomTextRenderer(document.getElementById("textfield--${uuid}"))) gauge.set(${temperatureSen.value}); </script> -
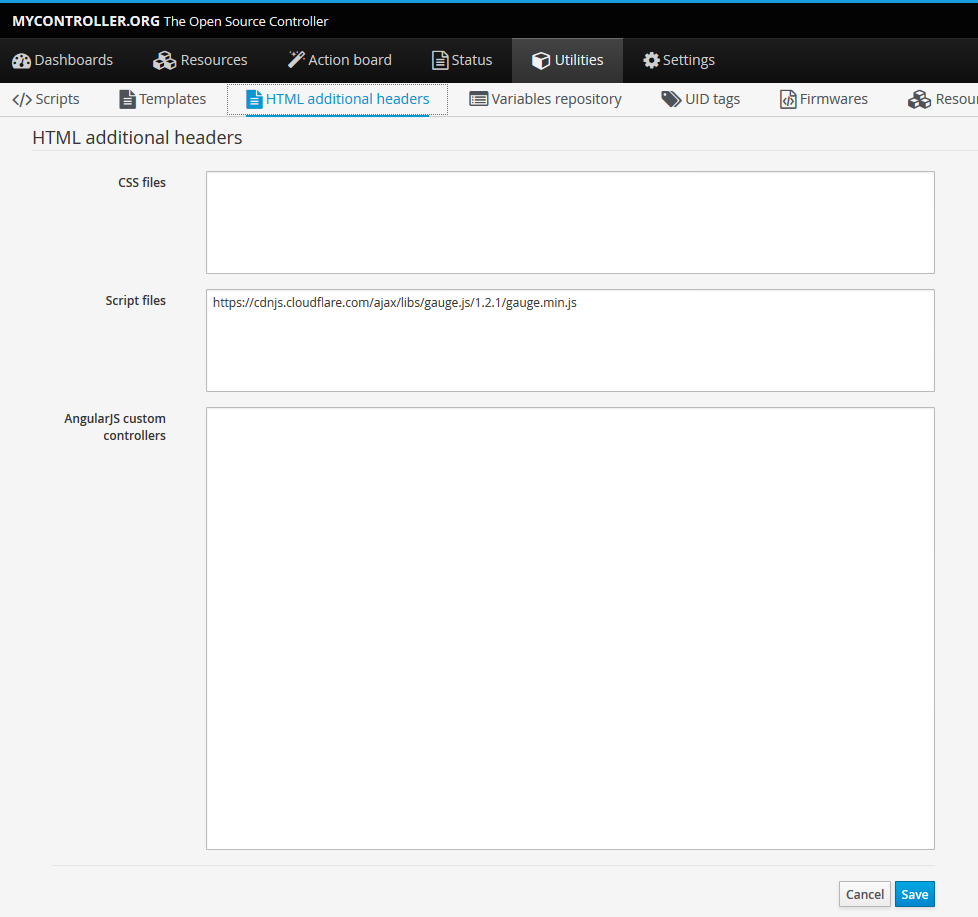
@esawyja I use this lib and works as expected for your script, https://cdnjs.cloudflare.com/ajax/libs/gauge.js/1.2.1/gauge.min.js
-
mmmh ok, then it must be something else
Still getting nothing
Even using Microsoft edge after clearing browser cache, history etc
-
This is how I clear the cache
-
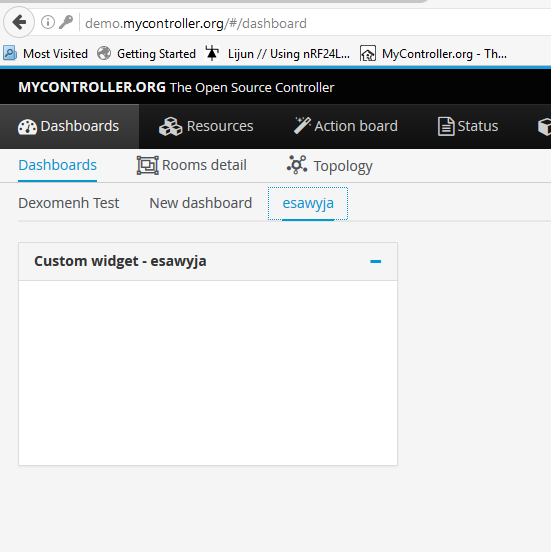
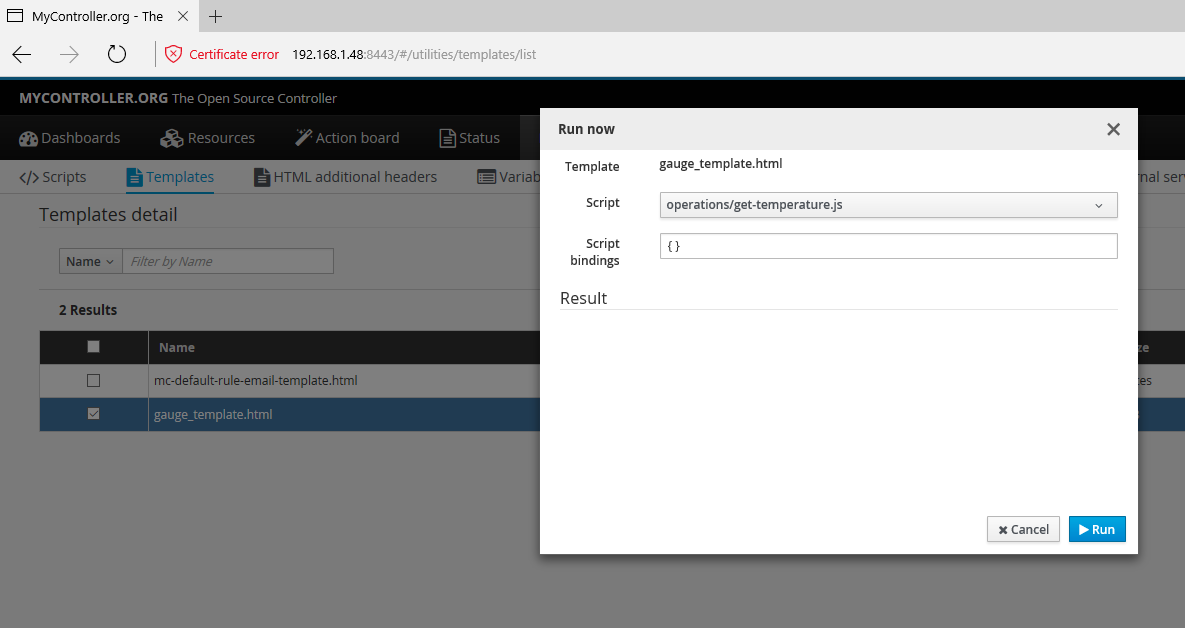
@esawyja I have updated this script on our demo server too. You can have a look at http://demo.mycontroller.org/#/dashboard, you can see a dashboard named
esawyjaSteps:
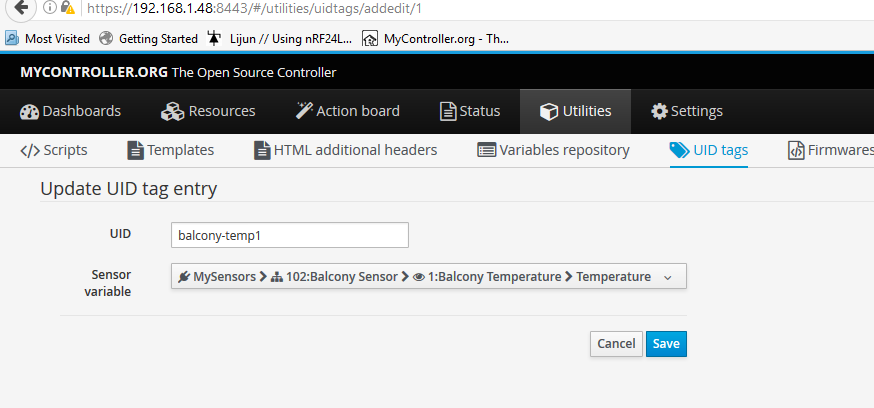
- Create UID tag for your temperature sensor
- Create Javascript to return value to HTML template
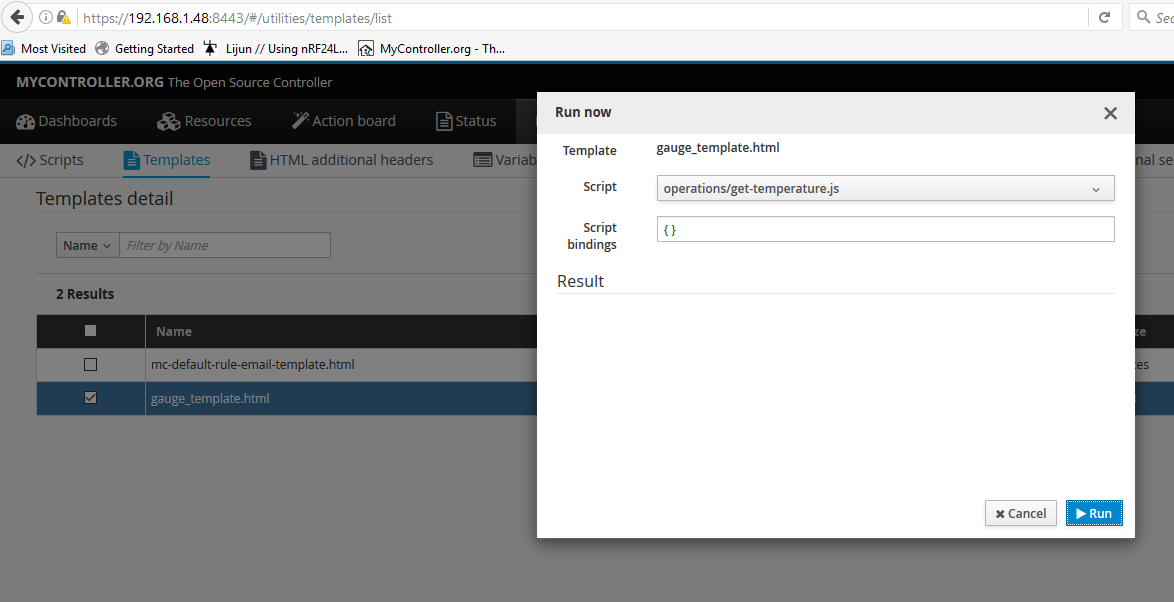
- Create HTML template
- Add you javaScript on script files, reload MC server page on your browser
- Create custom widget with template(step#3) and script(step#2), done!
")
IMPORTANT: I believe you are with latest SNAPSHOT version.
-
aaah ok, so it is something on my computer locally, do you need any external programs etc to display this, I don't see the gauge on the demo server either