miscellaneous question
-
can we improve the selection of resources?
yes the problem is that the frame is too small ( see the 1st image of the file )It is limited to display only 10 response, if you want to narrow down the result you can use different filter, for example, If you want to filter a node with id
56and gateway idGwCan. in the filter box typegateway=GwCan,nodeid=56
you can filter with any available keys,
some of useful keys- gatewayid
- nodeid
- sourceid
- fieldid
and why sometimes some sensors don't want to remobter on MyC
( see the 2nd image of the file )For some reason, the name of the node is not received and kept it empty, I have fixed this in MyController, now if name not received by MyController, will be displayed as
unknownRe-
after 2 hours still nothing on the node55 (test reset reboot)
I reloaded the sketch and MyC recognized the 55!On this gateway you see the problem only with the specific node(
55)? If you receive nothing from the gateway, just reload the gateway and see how it goes? -
@JeeLet said in miscellaneous question:
So I test and test, I add and remove regularly nodes and gateway, MyC and put to the test, but it holds good

Well, today I had to start over on a clean beach, a clean reinstall, the ghost nodes did not want to leaveafter 2 hours still nothing on the node55 (test reset reboot)
I reloaded the sketch and MyC recognized the 55!I have had 'ghost nodes' in MC ver 1.6.0 - These are nodes showing in the list that do not exist in real life. I am hoping that a new SSD sata to USB adapter has cured this for me. Note I also went from 2 gateways back to one. Even with external power supply there was still an issue on booting with both gateways attached.
If you are testing a lot of things please remember to use the mysensors 'clear eeprom' before reusing a node or gateway, it can cause issues if previous data stored in there (like routing table) are not removed before re-flashing. Maybe you already do this, but is worth mentioning anyway.
-
I took my time to answer you, test and verify before .
skywatch
- Yes, deleting the EEprom is something I do.
- and for the ghost "elements", it's because sometimes I physically delete an "element" before deleting it in MyC
(but even then it's not sure, to check)
jkandasa
-
thanks for the solution : ".... use a filter .... gateway=GwCan,nodeid=56 "
-
"...you see the problem only with the specific node ( 55) "
The problem is solved ( it was on MyS_CAN side )
question (again
 )
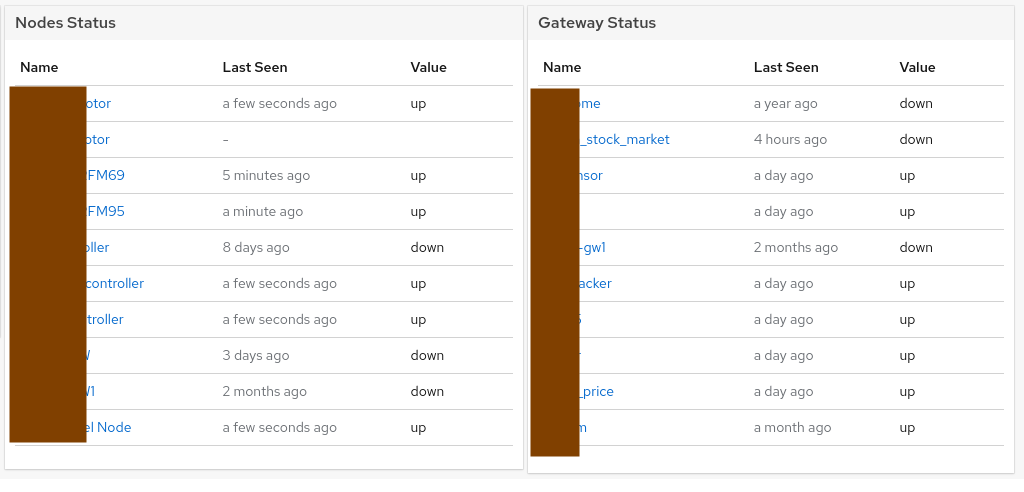
)here is a screen shot of the problem, the status of the gateways. screen
they are well functional, in the page Gateway the visual status is well in green (activated") but in the page of the Nodes, the gateway are in red.
after a command : > Action > Reboot of the Gateway and they become green again ( but not for long )
(in the logs there is nothing )Edit
I think it's the presentation void in the Gateways sketch that MyController doesn't likevoid presentation() { sendSketchInfo("GatewaySerial-CANbus", "2.0"); }Re-edition
no it wasn't that, I deleted that partBut the problem comes back to the goal of half an hour
-
@JeeLet said in miscellaneous question:
they are well functional, in the page Gateway the visual status is well in green (activated") but in the page of the Nodes, the gateway are in red.
The page of the node, it is a status of the node. not the gateway. The default inactive interval is
15m,
But you can update the global inactive interval inSettings >> System >> Edit

You can also update this interval for a specific node by adding a label in that node. example:
inactive_duration: 5h, == 5 hours,

If there is no message received in a specific period(aka inactive_interval) from a node, that particular node marked as Down. When new message arrives in that node, again the status changed to Up.
-
I have
nothing, not understood everything.so the Arduino that I connect to my Odroid
is not only a gateway (a bridge)
but it's also a Node, but that is not used ?you can give me a small piece of sketch that I place in the "gateway" for me MyC think that the Node 0 is used for what things.
But maybe I will test the node to node (0 with 55) to check the reliability of the CAN bus, a cyclic thing.
question:
there is a LOG file to recover the information of Active/Inactive ???Thanks
-
@JeeLet This is just an indicator that your node didn't send data for a specified period of time and marked as Down. But nothing affected in functionality. It is just a visual indicator, MyController assumes that your node is Down, as it is not receiving any data for a while. This status will not impact anything.
Please let me know, if still, this is not clear, I will try to explain in different way.there is a LOG file to recover the information of Active/Inactive ???
There is no log for this
-
Hello jkandasa
thank you for your pedagogical patienceBut the gateway, basically, its primary function is a bridgehead between the constellation of sensors MyS and MyC.
it doesn't have to be a node,
and for "This is just an indicator" for me Green=cool, Red=danger ..... an Orange for "you have seen"

on the other hand not being able to use this feature of the "no data" indicator routine is a shame.
Can you use it for a time stamp to monitor the nodes?
Yes MyController is good ... More questions soon

Thanks
-
@JeeLet said in miscellaneous question:
But the gateway, basically, its primary function is a bridgehead between the constellation of sensors MyS and MyC.
it doesn't have to be a node,MySensors gateway can be a node too. So we have created a node with id
0. Example: https://forum.mysensors.org/topic/4765/the-sensor-network/41and for "This is just an indicator" for me Green=cool, Red=danger ..... an Orange for "you have seen"

To understand quickly I mentioned that it is just an indicator. beyond this, you can trigger a task based on the node status change.
example: perform gateway reload if there is a node status changed to down(in mysensors node 0), send telegram, etc.,on the other hand not being able to use this feature of the "no data" indicator routine is a shame.
I do not get this question. Can you please elaborate?
Can you use it for a time stamp to monitor the nodes?
Node status updated using lastSeen. When there is a message received for the node, LastSeen has been updated.
-
Ouch
the translation of the languages, or the puns are not clear
I simplify my text, and also you have partly answered my question.
how to use "LastSeen"
. to make an action. but how?
. the value can it be put in a widget, for a synoptic with the dashboard
( to have a dashboard of some elements of the system, monitoring on a single page of several different families, states and temperatures
the concept of
synoptic
supervisorto have on the same page, an overview of the important elements.
. System alarms (MyS, status of nodes and other elements)- Equipment alarms (house, temperatures, intrusion ...)
-
@JeeLet It is possible to put the node status on the dashboard, select
Noderesource and use the keystate.status. To know other possible keys just look at node edit page and yaml view. nested keys can be formed with. -
I still don't understand some of the subtleties of MyController

I tested as you say, but nothing works.
the Yaml file
title: Panel Title
showTitle: true
scrollbarDisabled: false
static: false
type: widget_control_panel
layout:
  w: 28
  h: 54
  x: 0
  'y': 90
config:
  resource:
    filters:
      metricType: binary
    type: field
  resources:
    - control:
        config:
          options:
            state.status: ''
        type: options_tab
      resource:
        nameKey: stat56
        quickId: GwCan.56
        type: node
    - control:
        config:
          options:
            state.status: ''
        type: options_tab
      resource:
        nameKey: stat55
        quickId: GwCan.55
        type: node
  tableView: true
  type: mixed_control
putting the status of the nodes and gateway on the dashboard is a good thing.
-
@JeeLet I will try to document MyController things,
for now you can go with the followings, It shows list of nodes and gateways,
If you want to display on the mixed resources, I can give an example, let me knowNodes
id: 8cd43dbd-b873-4712-b855-789a6501e673
title: Nodes Status
showTitle: true
scrollbarDisabled: false
static: false
type: widget_utilization_panel
layout:
  w: 33
  h: 117
  x: 31
  'y': 0
config:
  resource:
    displayName: true
    filter: {}
    filterType: detailed_filter
    isMixedResources: false
    limit: 10
    nameKey: name
    quickId: ''
    resources: []
    roundDecimal: 0
    timestampKey: lastSeen
    type: node
    unit: ''
    valueKey: state.status
  table:
    displayStatusPercentage: false
    hideBorder: false
    hideStatusColumn: true
    hideValueColumn: false
    maximumValue: 100
    minimumValue: 0
    thresholds: {}
  type: table
Gateways
id: bf2e078a-b4eb-4df2-b119-773ae47909ef
title: Gateway Status
showTitle: true
scrollbarDisabled: false
static: false
type: widget_utilization_panel
layout:
  w: 31
  h: 118
  x: 64
  'y': 0
config:
  resource:
    displayName: true
    filter: {}
    filterType: detailed_filter
    isMixedResources: false
    limit: 10
    nameKey: id
    quickId: ''
    resources: []
    roundDecimal: 0
    timestampKey: state.since
    type: gateway
    unit: ''
    valueKey: state.status
  table:
    displayStatusPercentage: true
    hideBorder: false
    hideStatusColumn: true
    hideValueColumn: false
    maximumValue: 100
    minimumValue: 0
    thresholds: {}
  type: table
-
Thank you @jkandasa
it's very good like that , it works well
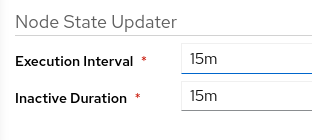
I put at 10minute /Node State Updater/ Execution Interval
"I'll try to document things MyController," ... yes the Labels / Key /Value part
. what tree structure
. family ? structure ???
. how to use them ?? create them ?? -
@JeeLet said in miscellaneous question:
. what tree structure
. family ? structure ???
. how to use them ?? create them ??You can refer the source code for all the keys. I will create document for this. but it will time

-
Hello jkandasa
It's been a long time, I hope you are well.
a question about the visualization of the curves of measurements.
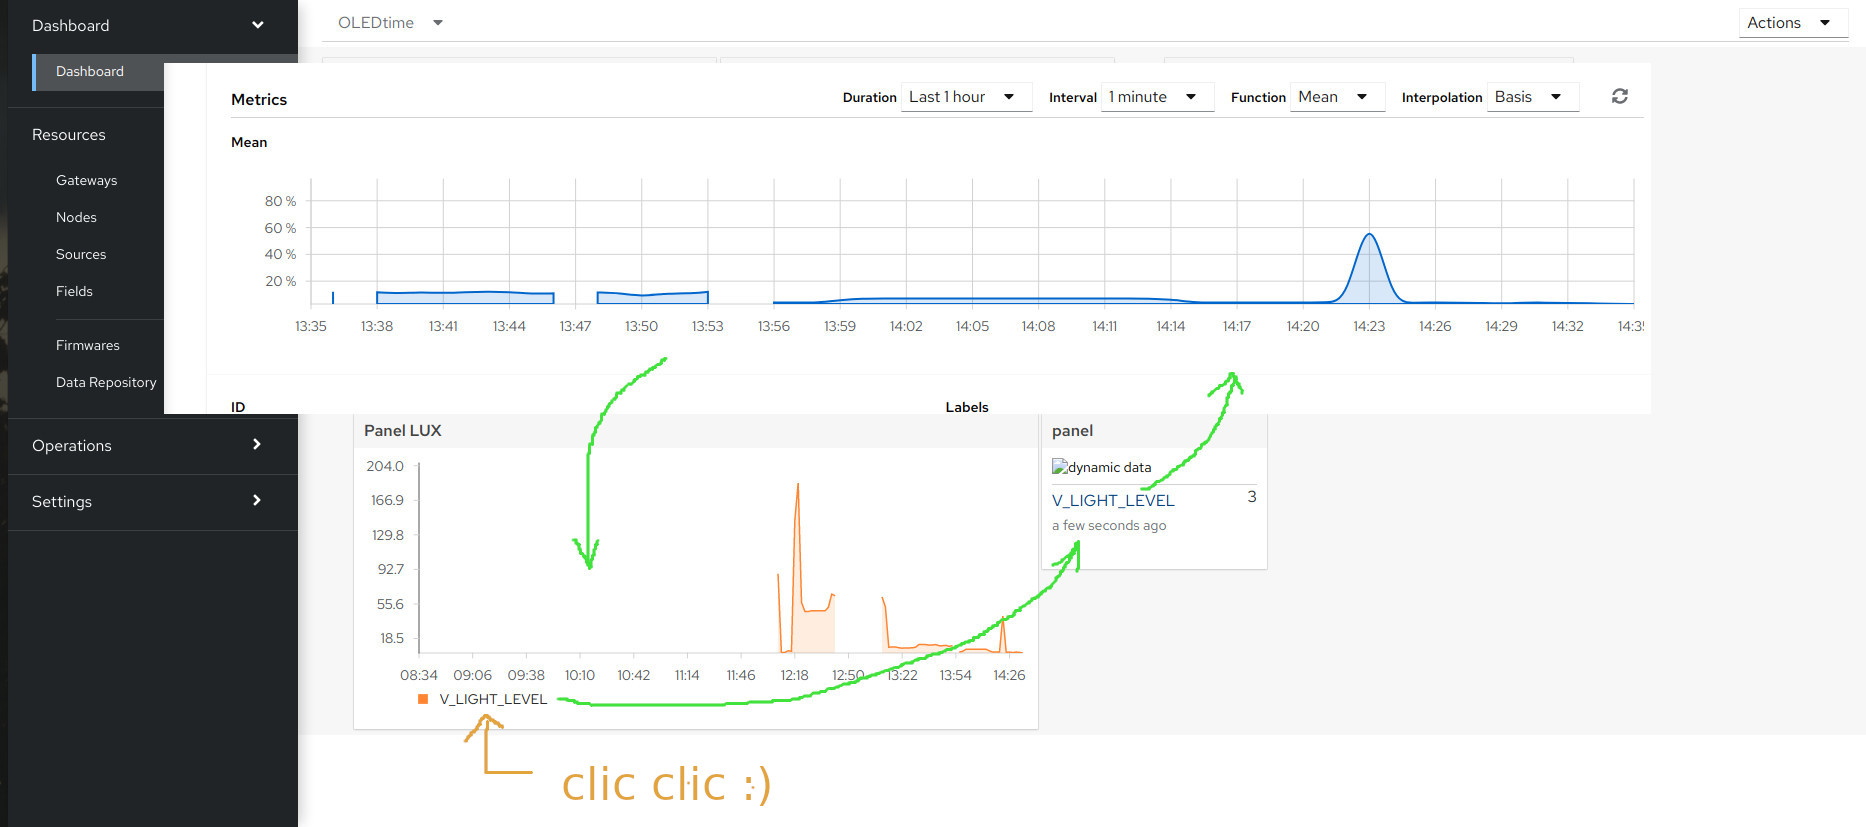
On my Dashboard I have to add a widget to visualize the values with the
"Field Details" which is more flexible to use.here is an image for the explanation

In the example, there is no way to do it by clicking on the element
V_LIGHT_LEVEL element of the "LuX panel"?Thanks
-
unnecessary message is cumbersome
... Delete .....

-
your issue could be in a number of places but if it helps for the BH1750 sensor I use V_LEVEL and S_LIGHT_LEVEL
MC does not need to know what the units are as you can change this to whatever you want.
-
Hello
I just realized that I've done something wrong

S_LIGHT_LEVEL --- to ---> S_LEVELthank you skywatch for cleaning my glasses
-
there are days that are not easy
the Lux Unit does not want to be considered
the part of the Yaml filefieldId: V_LEVEL name: V_LEVEL metricType: gauge_float .... unit: '' <------ ???? labels: ms_node_id: '58' ms_sensor_id: '5' ms_type: '37' ms_type_string: V_LEVELI give it the "Lux" value but it doesn't keep it

-
@JeeLet I give it the "Lux" value but it doesn't keep it

You can ignore the default unit by adding a label
ignore_unit:true, this is applicable for name and metric type.
if you change any of the following from the default to custom value useignore_*label.Example:
- I changed the
name,unit, andmetricType
labels:
  ignore_name: "true"
  ignore_unit: "true"
  ignore_metric_type: "true"
to know more about defined labels: https://github.com/mycontroller-org/server/blob/6ce7df3a32325af16fb87b638cd45c58110cbe1d/pkg/types/labels.go
- I changed the