btw:
could you pls change the topic into:
"MyController V2.0 no metrics on the Dashboard"
if that makes sense 
Thank you so much
btw:
could you pls change the topic into:
"MyController V2.0 no metrics on the Dashboard"
if that makes sense 
Thank you so much
...changing to Utilization Panel did the trick!
Now I´m getting metrics into the Dashboard 
Also the filter looks logical to me (GW.Node.Type.Value):
Hey all,
I installed MyController v2.0 on a NanoPi.
InfluxDB v1 is up and running.
I also connected a MySensors serial Gateway plus few sensors - all good:

But I´m not able to show any metrics on the Dashboard ;(
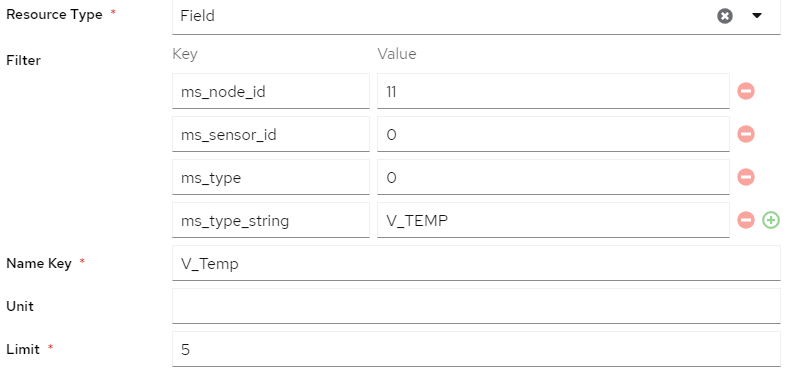
The Resource config for a Line Chart looks like:

but I´m always getting > Error: no resource available to get metric data
Any hint on this?
Or documentation for v2.0 yet..?
;))
Thank you so much!