Monitoring electricity consumption
-
Hi,
I've set up an electricity monitoring node, which basically counts pulses from my power meter (see https://www.mysensors.org/build/pulse_power) and it's working fine. But, it sends electricity consumption as kwh. What I'd like to do is to summarise this as watts each hour, so that you can see the consumption for each hour. I could calculate this in the sensor, but I was wondering if you could do something within mycontroller. So, for example each hour, find the total kwh used, and plot that. That way you can more easily see which periods of the day use more power than others.Is this the sort of thing you can do within MyController.org?
-
@rjad In graph there is no direct way for this. however we can get metrics by
bucketDuration, I will check this in custom widget and update you soon.Sorry for the late response, I was out off action last few days. Thanks!
-
Thanks jkandasa,
I'd be happy to get any tips on using bucketDuration, so let me know how you go. No rush though obviously. -
@rjad Following setup will fulfil your requirement,
Steps:
- Added
ng-controllerscript to get data from MyController. Add this script onUtilities >> HTML additional headers >> AngularJS custom controllers. All the following script.
myControllerModule.controller('McCustomGraph', function($scope, $interval, mchelper, $filter, MetricsFactory, TypesFactory, CommonServices){ $scope.cs = CommonServices; $scope.updateChart = function(chData){ chData.showError = false; chData.showLoading = true; MetricsFactory.getMetricsData( {"variableId":chData.variableId, "withMinMax":chData.withMinMax, "start": new Date().getTime() - (chData.lastNseconds*1000), "bucketDuration": chData.bucketDuration}, function(resource){ if(resource.length > 0){ var customGraph = {}; customGraph.chartOptions = { chart: { type: 'lineChart', noErrorCheck: true, height: 225, margin : { top: 5, right: 20, bottom: 60, left: 65 }, color: ["#2ca02c","#1f77b4", "#ff7f0e"], noData:"No data available.", x: function(d){return d[0];}, y: function(d){return d[1];}, useVoronoi: false, clipEdge: false, useInteractiveGuideline: true, xAxis: { showMaxMin: false, tickFormat: function(d) { return d3.time.format('hh:mm a')(new Date(d)) }, //axisLabel: 'Timestamp', rotateLabels: -20 }, yAxis: { tickFormat: function(d){ return d3.format(',.2f')(d); }, axisLabelDistance: -10, //axisLabel: '' }, }, title: { enable: false, text: 'Title' } }; customGraph.chartTimeFormat = mchelper.cfg.dateFormat; customGraph.chartOptions.chart.xAxis.tickFormat = function(d) {return $filter('date')(d, customGraph.chartTimeFormat, mchelper.cfg.timezone)}; customGraph.chartData = resource[0].chartData; //Update display time format customGraph.chartTimeFormat = resource[0].timeFormat; customGraph.chartOptions.chart.type = resource[0].chartType; customGraph.chartOptions.chart.interpolate = resource[0].chartInterpolate; if(resource[0].dataType === 'Double'){ customGraph.chartOptions.chart.yAxis.tickFormat = function(d){return d3.format('.02f')(d) + ' ' + resource[0].unit}; }else if(resource[0].dataType === 'Binary' || resource[0].dataType === 'Counter'){ customGraph.chartOptions.chart.yAxis.tickFormat = function(d){return d3.format('.0f')(d)}; } customGraph.chartOptions.title.text = resource[0].variableType; customGraph.resourceName = resource[0].resourceName; customGraph.internalId = resource[0].internalId; chData.showLoading = false; chData.customGraph = customGraph; }else{ chData.showError = true; } }); } });- Create custom HTML template to display our chart. Create it on
Utilities >> Templates >> Add template
<div ng-app="myController" ng-controller="McCustomGraph" ng-init="chData={'variableId': ${item.variableId}, 'withMinMax':${(item.withMinMax?c)!"false"}, 'lastNseconds':'${(item.lastNseconds?c)!"86400"}', 'bucketDuration':'${(item.bucketDuration)!"1h"}', 'showLoading':true};updateChart(chData);"> <!-- Loading icon disaplay --> <div ng-if="chData.showLoading"> <div ng-include src="'partials/common-html/loading-sm.html'"></div> </div> <div ng-if="chData.showError"> <div ng-include src="'partials/common-html/error-sm.html'"></div> </div> <div ng-if="!(chData.showLoading || chData.showError)"> <span class="mc-pointer" ng-bind-html="chData.customGraph.resourceName | mcResourceRepresentation" ui-sref="sensorsDetail({id: chData.customGraph.internalId})"></span> <nvd3 id="asg-{{chData.variableId}}" options='chData.customGraph.chartOptions' data="chData.customGraph.chartData"></nvd3> </div> </div>-
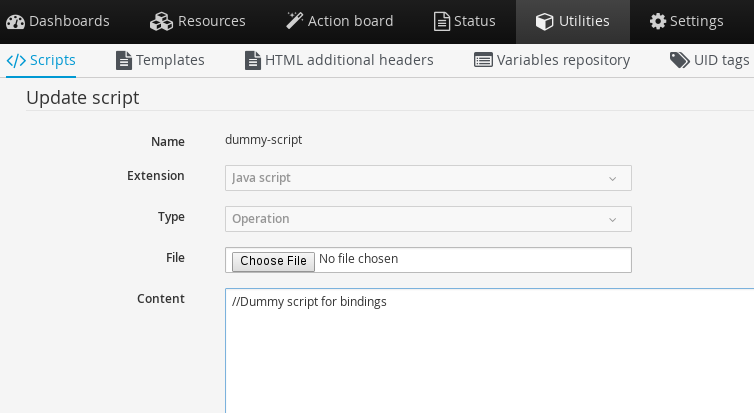
Create dummy script to support bindings on template. When we use bindings, we can reuse the same script for multiple sensorVariables
-
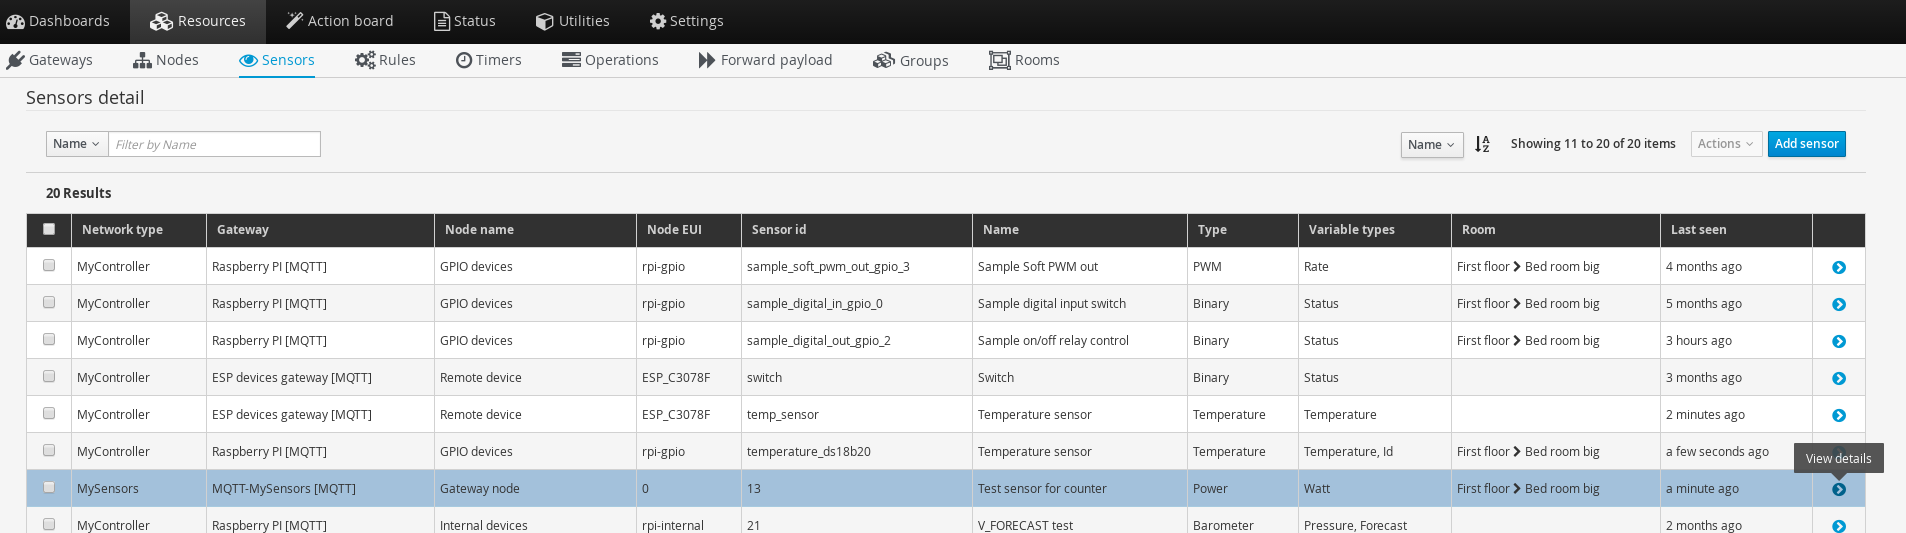
Now get
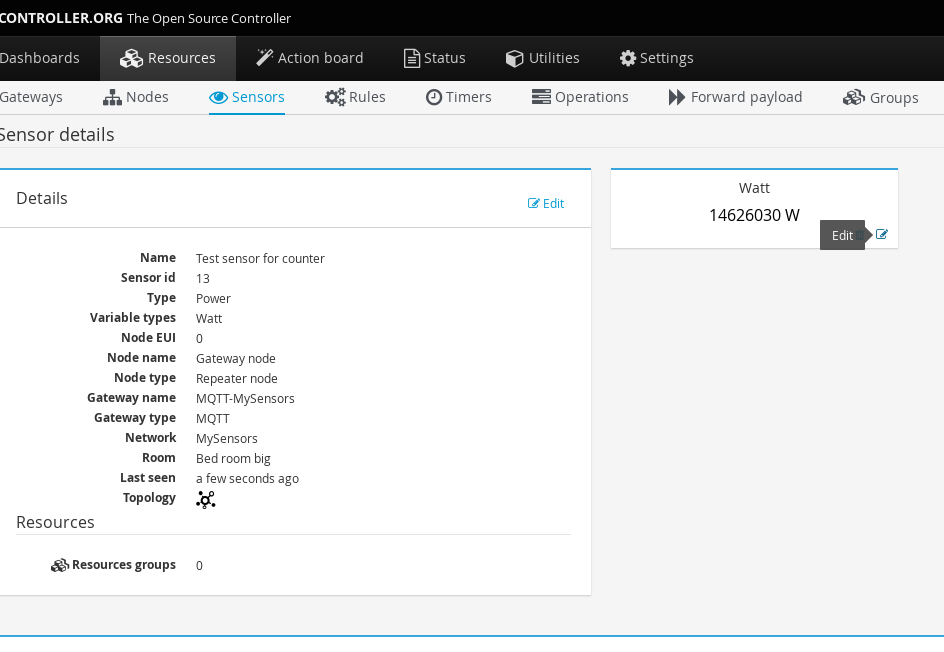
SensorVariableid from Sensors page.Resources >> Sensors >> Click on view details,
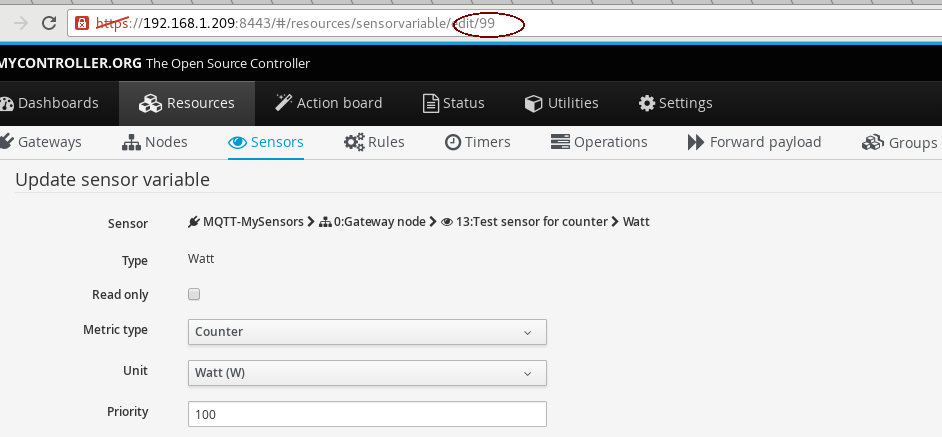
Now click on edit ofsensor variable
On the URL you can see sensor variable id, This is id is important note it for your target
sensor variable
- Now it is time to display your custom graph,
Bindings:
{"item":{'variableId': 99, 'withMinMax':false, 'lastNseconds':86400, 'bucketDuration':'1h'}}Note: Script binding details,
variableId- This is your target sensor variable idlastNseconds- value as integer (Example:"lastNseconds":86400and this is default value)withMinMax- default,falsebucketDuration- This is the value to group data. Supports for,raw,1mn- minute,1h- hour,1d- day,1m- month- Example:
1h- 1 hour,6h- 6 hours,5mn- 5 minutes,7d- 7 days
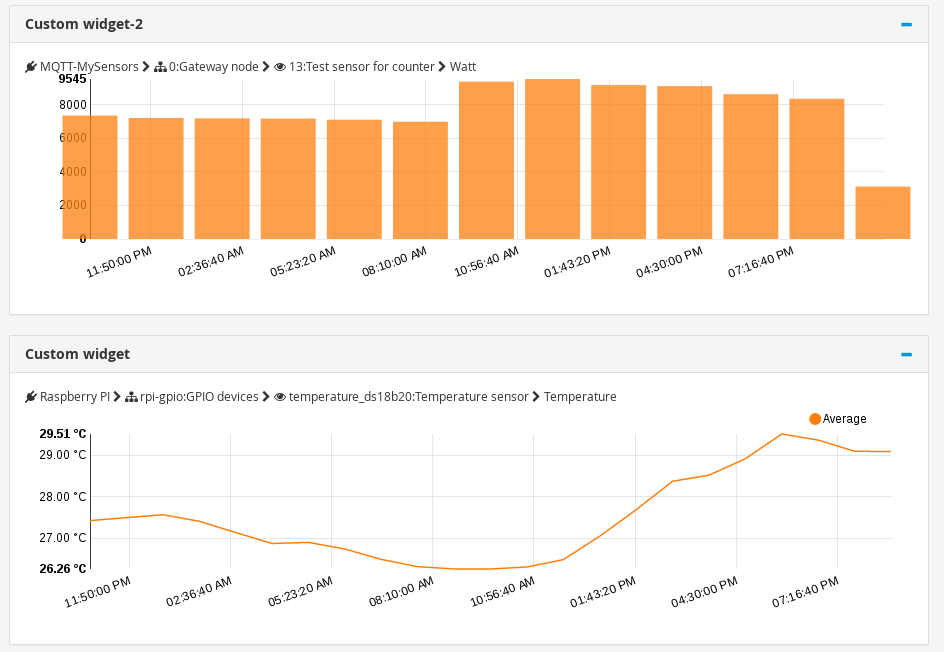
- Now all set ready, you can see the chart as follows

- Added
-
Ok,I tested this but couldn't get it to work. Presumably I didn't follow the instructions properly. To try to understand it better, and to amuse myself, I wrote a script to do what I want, more or less. I use a javascript script to grab the data that I want:
// so you can optionally pass the bindings
// {'binHours': 12, 'nBins': 12}
// but if you don't doesn't matter.

var myImports = new JavaImporter(java.io, java.lang, java.util, java.text);

with(myImports) {

var sVar = mcApi.uidTag().getByUid("kwh_uid").getSensorVariable();
var powerUsed = [];
var endTimes = [];

// check for some possible bindings:
if( typeof binHours === 'undefined' || !binHours ) {
  var binHours = 1
}

if( typeof nBins === 'undefined' || !nBins ) {
  var nBins = 5;
}
var binDuration = 1000*60*60*binHours;  //  hours in milliseconds

var endTime =  Date.now();
var startTime;

for(var i=0; i< nBins; i++ ) {
  startTime = endTime - binDuration;
  minMaxData = mcApi.metric().getSensorVariableMetricDouble(sVar, startTime, endTime);
  powerUsed[i] = minMaxData.maximum - minMaxData.minimum;
  endTimes[i] = endTime.toString();
  endTime = startTime;
  }
}
And a template using d3.js:
<link rel=stylesheet type="text/css" href="myd3.css">
<div id="wrapper" style="text-align: center">
  <canvas id="simpled3" style="display: none;"></canvas>
  <div style="font-size:11px" id="viz"></div>
</div>
<script>

var margin = {
    top: 15,
    right: 20,
    bottom: 30,
    left: 30
};
var width = 900- margin.left - margin.right;
var height = 360 - margin.top - margin.bottom;

// we get the data from the script

var x = d3.time.scale().range([0, width]);
var y = d3.scale.linear().range([height, 0]);

var xAxis = d3.svg.axis().scale(x)
    .orient("bottom").ticks(5);

var yAxis = d3.svg.axis().scale(y)
    .orient("left").ticks(5);

var valueline = d3.svg.line()
     .interpolate("step-before")
    .x(function (d) {
      return x(d.date);
    })
    .y(function (d) {
      return y(d.watts);
    });

var svg = d3.select("#viz")
    .append("svg")
    .attr("width", width + margin.left + margin.right)
    .attr("height", height + margin.top + margin.bottom)
   .attr("style", "outline: thin solid black;")
    .append("g")
    .attr("transform", "translate(" + margin.left + "," + margin.top + ")");

// Get the data
// should look like an array
// with each element date: milliseconds, watts: double
//

var data = [];
// get the values from the hash
// being careful of the indices which
// turn out to be character strings
var hashIndex;

<#list endTimes?keys as k>
 hashIndex = +${k};
 data[hashIndex] = {date: new Date(+${endTimes[k]}),
                    watts: +${powerUsed[k]}}
</#list>

// Scale the range of the data
x.domain(d3.extent(data, function (d) {
    return d.date;
    }));
y.domain([0, d3.max(data, function (d) {
    return d.watts;
    })]);

svg.append("path") // Add the valueline path.
.attr("d", valueline(data));

svg.append("g") // Add the X Axis
.attr("class", "x axis")
    .attr("transform", "translate(0," + height + ")")
    .call(xAxis);

svg.append("g") // Add the Y Axis
.attr("class", "y axis")
    .call(yAxis);
</script>
Some settings are in the custom css file. You can then create a plot, specifying the size in hours of each bin (1 hour by default), and the number of bins to plot. It looks like:

So you can see when we get up in the mornings and when we cook tea in the evenings
")
With some work it could be better, so for example, I lose the hover information, and I had trouble getting two of these plots on one dashboard with different bins. But I'm not too worried, since at the moment my main concern is why the sensor keeps dropping out. When I work out my hardware issues I might try to do better with the software.
Thanks
Robert -
Ok,I tested this but couldn't get it to work. Presumably I didn't follow the instructions properly.
When you do changes on HTML additional headers, you have to reload the browser. I hope you did this.
With some work it could be better, so for example, I lose the hover information, I had trouble getting two of these plots on one dashboard with different bins.
For hover information, I do nit get any clue. As I never worked directly with the D3 chart.
For the multiple of charts on same dashboard issue, you might have chart id issue.
Maybe because of this one,<canvas id="simpled3" style="display: none;"></canvas>