• header.categories
    • header.recent
    • header.tags
    • header.popular
    • register
    • login

    MyController V2.0 no metrics on the Dashboard

    scheduled pinned locked moved Troubleshooting
    6 posts 3 posters 867 views 2 watching
    loading-more-posts
    • oldest-to-newest
    • newest-to-oldest
    • most-votes
    reply
    • reply-as-topic
    guest-login-reply
    deleted-message
    • V offline
      vidpix
      global:last-edited-by, jkandasa

      Hey all,

      I installed MyController v2.0 on a NanoPi.
      InfluxDB v1 is up and running.
      I also connected a MySensors serial Gateway plus few sensors - all good:

      4608ca47-61e8-436e-ad96-dec5a028e483-image.png

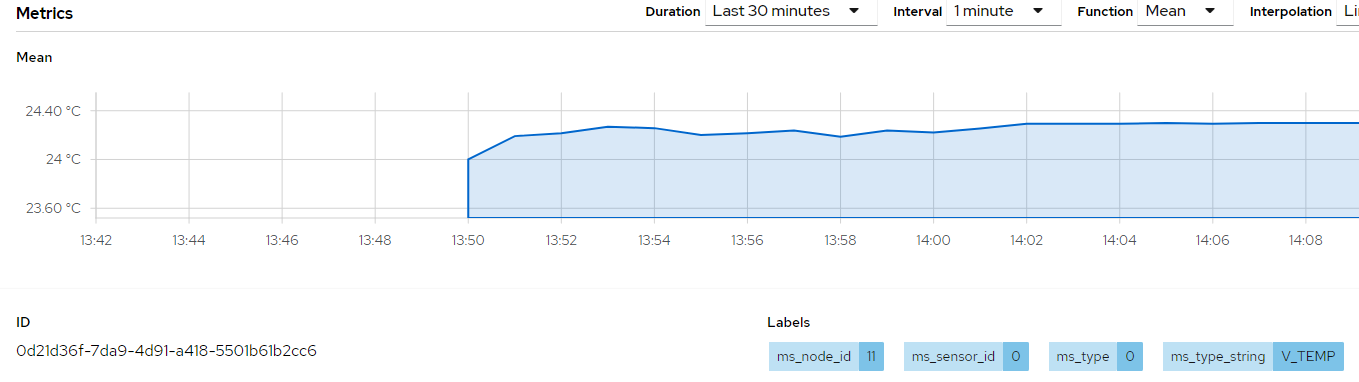
      But I´m not able to show any metrics on the Dashboard ;(
      The Resource config for a Line Chart looks like:
      58a3175f-bc94-4256-aec8-398bfffafb83-image.png

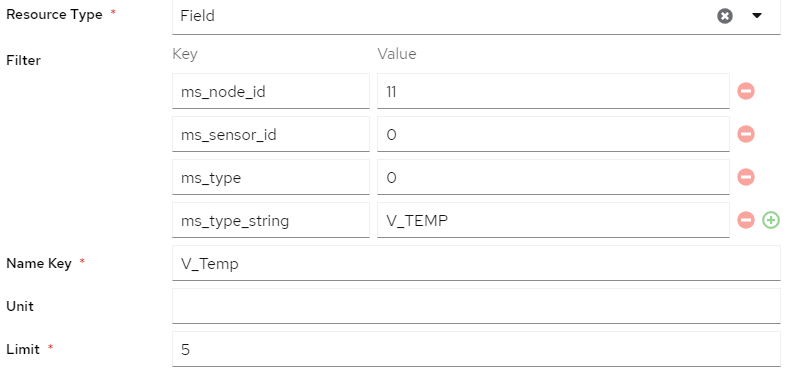
      but I´m always getting > Error: no resource available to get metric data
      Any hint on this?
      Or documentation for v2.0 yet..?

      ;))

      Thank you so much!

      jkandasaJ one-reply-to-this-post last-reply-time reply quote 0
      • J offline
        JeeLet
        global:last-edited-by, jkandasa

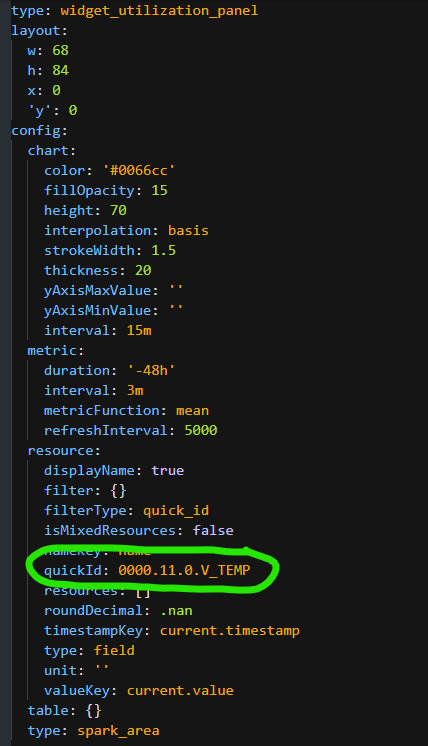
        in Yaml format it's easier to understand your problem.

        welcome with MyController, the minimalist of the minimalists 🙂

        Here is an example of a temperature sensor on one of my Dasboards

        8565-f5945591f8bc
        title: Sallon  -  Sensor Temp   -  12hours
        showTitle: true
        scrollbarDisabled: false
        static: false
        type: widget_utilization_panel
        layout:
          w: 37
          h: 53
          x: 35
          'y': 0
        config:
          chart:
            color: '#ffa940'
            fillOpacity: 15
            height: 70
            interpolation: basis
            strokeWidth: 1.5
            thickness: 20
            yAxisMaxValue: ''
            yAxisMinValue: ''
          metric:
            duration: '-12h'
            interval: 3m
            metricFunction: percentile_99
            refreshInterval: '300000'
          resource:
            displayName: true
            filter: {}
            filterType: quick_id
            isMixedResources: false
            nameKey: name
            quickId: GwRs485.33.9.V_TEMP
            resources: []
            roundDecimal: 0
            timestampKey: current.timestamp
            type: field
            unit: deg
            valueKey: current.value
          table: {}
          type: spark_area
        
        
        one-reply-to-this-post last-reply-time reply quote 1
        • V offline
          vidpix
          global:last-edited-by,

          ...changing to Utilization Panel did the trick!
          Now I´m getting metrics into the Dashboard 🙂
          Also the filter looks logical to me (GW.Node.Type.Value):

          one-reply-to-this-post last-reply-time reply quote 0
          • V offline
            vidpix
            global:last-edited-by,

            609c3243-176b-45b4-812a-4514391859f2-image.png

            one-reply-to-this-post last-reply-time reply quote 0
            • V offline
              vidpix
              global:last-edited-by,

              btw:
              could you pls change the topic into:
              "MyController V2.0 no metrics on the Dashboard"
              if that makes sense 😉

              Thank you so much

              one-reply-to-this-post last-reply-time reply quote 1
              • jkandasaJ offline
                jkandasa @vidpix
                global:last-edited-by,

                @vidpix welcome to MyController 🙂
                if you use labels as filter append labels. as prefix of the key.
                samples: labels.ms_node_id, labels.ms_sensor_id

                in the filter key you can choose anything. you can easily understand if you see yaml view of a field.

                one-reply-to-this-post last-reply-time reply quote 0
                • first-post
                  last-post

                0

                online

                644

                users

                532

                topics

                3.4k

                posts
                Copyright © 2015-2025 MyController.org | Contributors | Localization