• Categories
  • Recent
  • Tags
  • Popular
  • Register
  • Login
  • Categories
  • Recent
  • Tags
  • Popular
  • Register
  • Login

getting correct values.....

Scheduled Pinned Locked Moved Troubleshooting
4 Posts 2 Posters 466 Views 1 Watching
Loading More Posts
  • Oldest to Newest
  • Newest to Oldest
  • Most Votes
Reply
  • Reply as topic
Log in to reply
This topic has been deleted. Only users with topic management privileges can see it.
  • S Offline
    skywatch
    last edited by 3 Jan 2019, 10:18

    Hi,

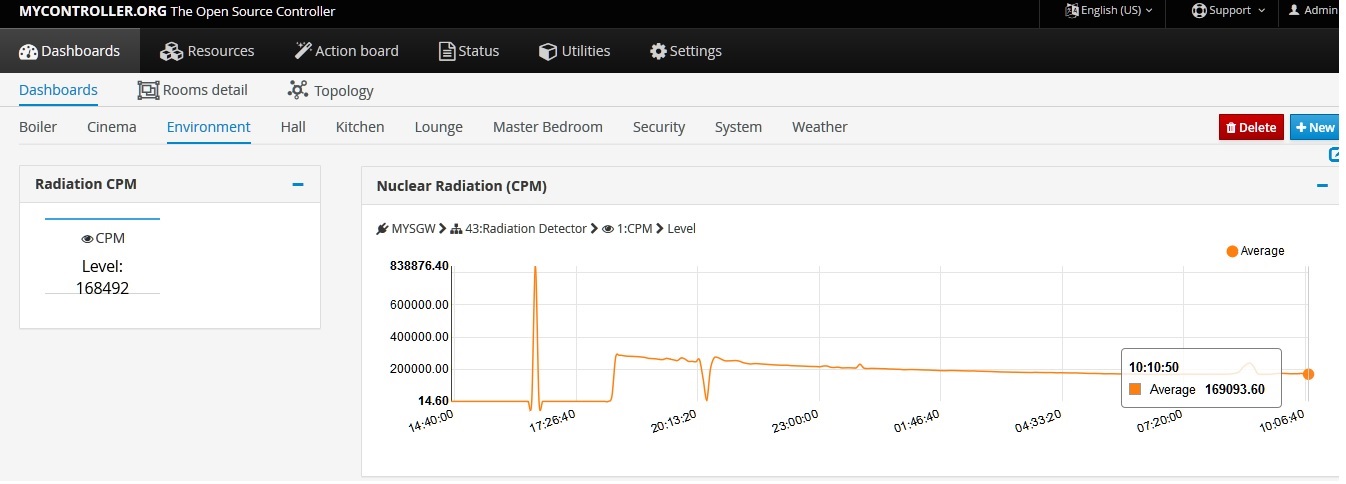
    I am curious as to why the values on the graph do not match those in the sensor window. Please see image below which illustrates the problem. Which value is correct?

    cpm.jpg

    J 1 Reply Last reply 3 Jan 2019, 10:35 Reply Quote 0
    • J Offline
      jkandasa @skywatch
      last edited by jkandasa 1 Mar 2019, 16:07 3 Jan 2019, 10:35

      @skywatch The graph returns the average value.

      Bonus point 🙂 : Change Items per row to 1 in Radiation CPM. The widget may fit properly.

      S 1 Reply Last reply 4 Jan 2019, 16:46 Reply Quote 0
      • S Offline
        skywatch @jkandasa
        last edited by 4 Jan 2019, 16:46

        @jkandasa Thanks for the info, but are the sensor values then not readable from the graph? The graph is only showing a general trend with no 'real life' actual spot values? I see the same when looking between dashboard and sensor graphs like this.....
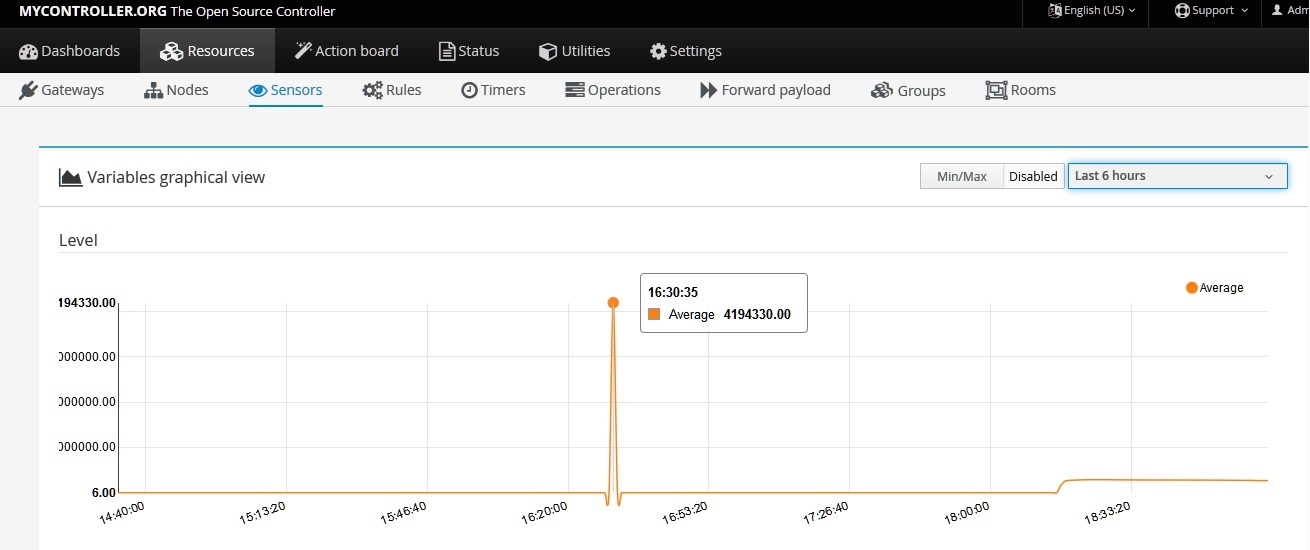
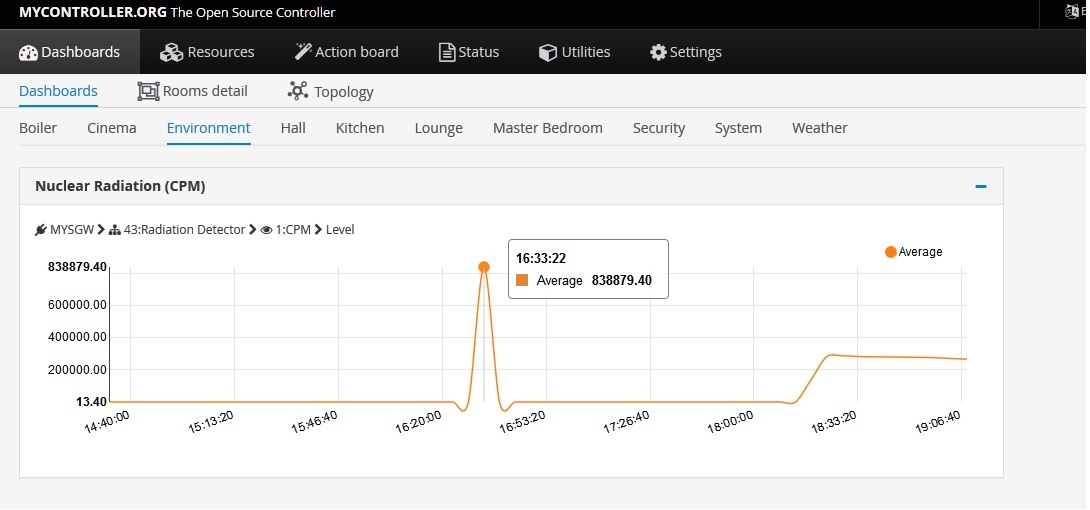
        Sensor.jpg

        versus this......

        dash.jpg

        As for the bonus, thanks but I already knew that - this was just a quick test of the geiger counter node that obviously has issues I need to look into....

        J 1 Reply Last reply 7 Jan 2019, 06:03 Reply Quote 0
        • J Offline
          jkandasa @skywatch
          last edited by 7 Jan 2019, 06:03

          @skywatch I guess dashboard graph and sensor page graph are in different time duration? Can you share dashboard graph settings screenshot?

          AFAIK, we could not keep all the data in our system, will lead disk issue, poor performance, etc.,
          In MyController we keep min,max,avg for a duration, as mentioned in metrics retention settings. If you enable min, max, avg, will cover all the data for a duration.

          1 Reply Last reply Reply Quote 0
          1 out of 4
          • First post
            1/4
            Last post

          0

          Online

          619

          Users

          531

          Topics

          3.4k

          Posts
          Copyright © 2015-2025 MyController.org | Contributors | Localization