[SOLVED] Spike and lock up problem
-
@jkandasa No - that is incorrect.
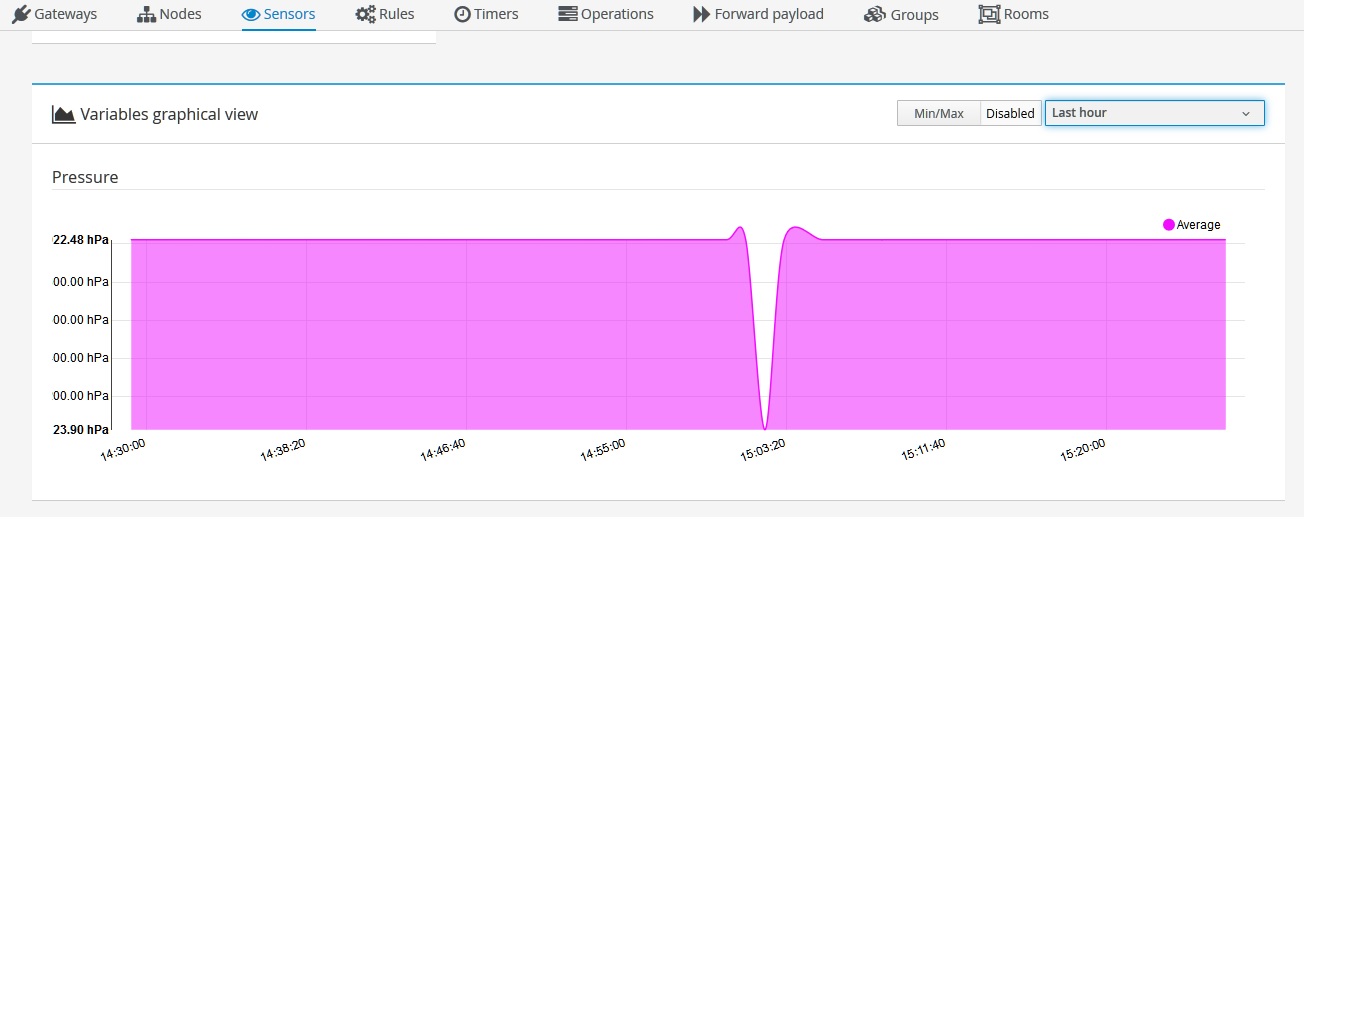
MyController graphs on the sensor pages do not auto algin margins with the data and crop it off at the axis. Did you notice the 00.00 in there? Would atmospheric pressue be 24 hpa? I think we'd all be dead!
The fake drop showing is from 1023.90 to 22.48 i.e. > 5.
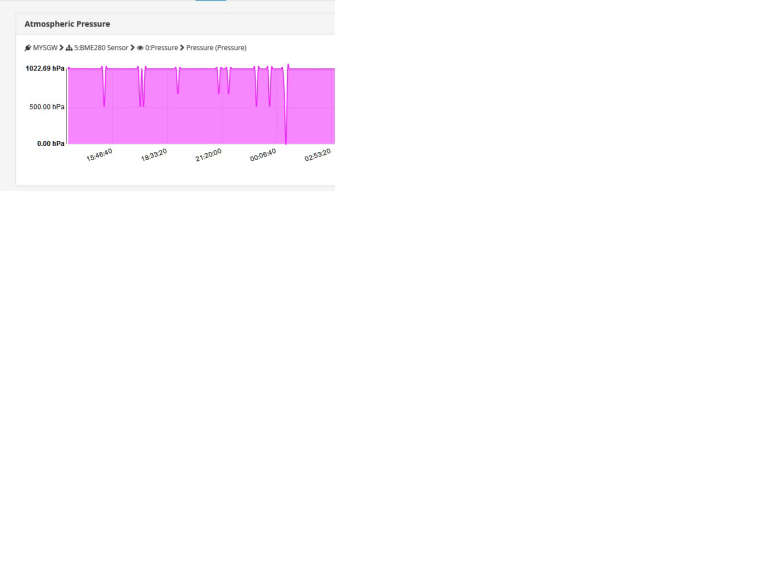
I have had lots more over night.

Temperature from the node is unaffected and is from the same BMP180 sensor.
Because of the software filter I can't see this being a sensor problem.
I will be moving from BMP180 to BME280 soon, but I have similar problem with other nodes using HTU21 and DHT22 as well. -
Would atmospheric pressue be 24 hpa? I think we'd all be dead!
LOL

I hope this problem from the node [or] from the serial driver, can enable debug log [OR] resources logs, to check the received data?
-
@jkandasa Here's a quick update....
Now I am running with a 5V 16MHz pro mini with direct serial connection to the pi at 115200 baud.
I have replaced the pressure sensor and pro-mini it was attached to with a new pro -mini and a BME280. This OFC means a completely new sketch straight off of the mysensors web site (so crossing fingers). Just changed to my node id and rf channel. I powered off of the laptop usb to hope it would get the best power possible.
I still get the spikes/plunges in data.
Waiting now for a ttl->usb board from China for the GW and wondering if a promicro wouldn't do the job (or maybe a uno via usb)?
-
@skywatch Well I am totally puzzled by this now.
Having done everything in my last post (replacing sensor + replacing all GW and NODE HW) I even added the following to the sketch...
if (pressure >= 870 && pressure <= 1085){
      Serial.println("BME280 - Sending the new pressure to the gateway.");
      send(pressureMsg.set(pressure, 2),true);
      lastPressure = pressure;
    }
I still get spikes. I'm baffled!
-
@skywatch I too confused now

I will add a new option to store raw logs in a separate file. So it will give clarity of this issue. -
@skywatch I have included debugging raw message option, download SNAPSHOT version and enable debug raw message.
enable raw message debugging in
mycontroller/conf/logback.xml, by default this logger will be in INFO mode. change it tolevel="DEBUG"<logger name="RAW_MESSAGE_LOGGER" level="DEBUG" additivity="false"> <appender-ref ref="GATEWAY_RAW_MESSAGE_APPENDER" /> </logger>You will get debug logs on
mycontroller/logs/raw_message_gw_*.log.Please note: From this build, I have enabled google analytics.
you can see the following agreement on the log file.****************************************** Data Processing Agreement ******************************************* By using this software you agree that the following non-PII (non personally identifiable information data will be collected, processed and used by MyController.org for the purpose of improving quality of this software. ---------------------------------------------------------------------------------------------------------------- If you do not like to share anonymous data(non-PII), disable it in 'mycontroller/conf/mycontroller.properties' by setting 'mcc.collect.anonymous.data=false' and **restart** this server and **logout and login** in the UI. ------ Thank you! ------ ****************************************************************************************************************If you do not like you can disable it by setting
mcc.collect.anonymous.data=falsein mycontroller.properties file. -
Thank you! - I will try and do this tomorrow or at the weekend.
Interestingly I got a negative reading on a dust sensor(!)! - Not sure how to properly interpret that one - Hehehe.....
")
-
I had some time today and took another look at this.
With 2 windows open, one showing the graph and one showing status>resource logs I was able to see the odd behaviour.
In resource logs I see the pressure data correctly being recieved. But the graph does not reflect the data. E.G. We have a big storm for last few days and today I see pressure of 1007.xx being shown in status>resource logs in three consecutive readings each a minute apart. But on graph I am seeing levels of 500 approx. This then morphed into 755 as the cardinal open probably interpolates this using time and values in database (guessing).
I will see how it goes for a few hours before doing anything else, might be interesting!
-
@skywatch IT didn't go well so I downloaded the snapshot as suggested and changed the conf file for DEBUG.
I am seeing this...
Version
    1.4.0-SNAPSHOT
Database schema revision
    1.04.05 - 2018 Sep 11
Database type
    H2 database embedded
Database version
    1.4.194 (2017-03-10)
Git commit:branch
    7a32c1294d8b669c3c28502ed1535e4063481cfc:development
Built on
    2018-10-10T00:40:46+0530
Build JDK
    1.8.0_181
Build tool
    Apache Maven 3.5.0
Is that correct?
And I have....
<!--

    Copyright 2015-2018 Jeeva Kandasamy (jkandasa@gmail.com)
    and other contributors as indicated by the @author tags.

    Licensed under the Apache License, Version 2.0 (the "License");
    you may not use this file except in compliance with the License.
    You may obtain a copy of the License at

       http://www.apache.org/licenses/LICENSE-2.0

    Unless required by applicable law or agreed to in writing, software
    distributed under the License is distributed on an "AS IS" BASIS,
    WITHOUT WARRANTIES OR CONDITIONS OF ANY KIND, either express or implied.
    See the License for the specific language governing permissions and
    limitations under the License.

-->
<configuration scan="true" scanPeriod="2 minutes">

  <appender name="FILE" class="ch.qos.logback.core.rolling.RollingFileAppender">
    <file>../logs/mycontroller.log</file>
    <encoder>
      <!-- <pattern>%date %level [%thread] [%logger:%line] %msg%n</pattern> -->
      <!-- Replace CR(\r) with string \r and LF(\n) with string \n-->
      <pattern>%date %level [%thread] [%logger:%line] %replace(%replace(%msg){'\r', '\\r'}){'\n', '\\n'}%n</pattern>
    </encoder>
    <rollingPolicy class="ch.qos.logback.core.rolling.FixedWindowRollingPolicy">
      <FileNamePattern>../logs/mycontroller_%i.log.zip</FileNamePattern>
      <MinIndex>1</MinIndex>
      <MaxIndex>5</MaxIndex>
    </rollingPolicy>
    <triggeringPolicy class="ch.qos.logback.core.rolling.SizeBasedTriggeringPolicy">
      <MaxFileSize>5MB</MaxFileSize>
    </triggeringPolicy>
  </appender>

  <appender name="STDOUT" class="ch.qos.logback.core.ConsoleAppender">
    <encoder>
      <pattern>%date %level [%thread] [%logger:%line] %msg%n</pattern>
    </encoder>
  </appender>

  <logger level="INFO" name="com.j256.ormlite" />
  <logger level="INFO" name="org.apache.http" />
  <logger level="INFO" name="org.jboss.resteasy.core" />
  <logger level="WARN" name="com.j256.ormlite.table.TableUtils" />
  <logger level="WARN" name="com.xeiam.sundial" />
  <logger level="WARN" name="org.quartz" />
  <logger level="WARN" name="io.moquette"/>
  <logger level="ERROR" name="io.moquette.persistence.mapdb.MapDBSessionsStore"/>
  <logger level="ERROR" name="io.moquette.spi.impl.PersistentQueueMessageSender"/>

  <logger level="INFO" name="org.mycontroller.standalone" />
  <logger level="INFO" name="org.mycontroller.standalone.api" />
  <logger level="INFO" name="org.mycontroller.standalone.api.jaxrs" />
  <logger level="INFO" name="org.mycontroller.standalone.auth" />
  <logger level="INFO" name="org.mycontroller.standalone.backup" />
  <logger level="INFO" name="org.mycontroller.standalone.db" />
  <logger level="INFO" name="org.mycontroller.standalone.db.dao" />
  <logger level="INFO" name="org.mycontroller.standalone.db.migration" />
  <logger level="INFO" name="org.mycontroller.standalone.email" />
  <logger level="INFO" name="org.mycontroller.standalone.fwpayload" />
  <logger level="INFO" name="org.mycontroller.standalone.gateway" />
  <logger level="INFO" name="org.mycontroller.standalone.gateway.ethernet" />
  <logger level="INFO" name="org.mycontroller.standalone.gateway.mqtt" />
  <logger level="INFO" name="org.mycontroller.standalone.gateway.phantio" />
  <logger level="INFO" name="org.mycontroller.standalone.gateway.philipshue" />
  <logger level="INFO" name="org.mycontroller.standalone.gateway.rest" />
  <logger level="INFO" name="org.mycontroller.standalone.gateway.serial" />
  <logger level="INFO" name="org.mycontroller.standalone.gateway.wunderground" />
  <logger level="INFO" name="org.mycontroller.standalone.group" />
  <logger level="INFO" name="org.mycontroller.standalone.jobs" />
  <logger level="INFO" name="org.mycontroller.standalone.loggers.LoggerMySql" />
  <logger level="INFO" name="org.mycontroller.standalone.message" />
  <logger level="INFO" name="org.mycontroller.standalone.metric" />
  <logger level="INFO" name="org.mycontroller.standalone.metric.jobs" />
  <logger level="INFO" name="org.mycontroller.standalone.mqttbroker" />
  <logger level="INFO" name="org.mycontroller.standalone.provider" />
  <logger level="INFO" name="org.mycontroller.standalone.provider.mycontroller" />
  <logger level="INFO" name="org.mycontroller.standalone.provider.mysensors" />
  <logger level="INFO" name="org.mycontroller.standalone.provider.phantio" />
  <logger level="INFO" name="org.mycontroller.standalone.provider.philipshue" />
  <logger level="INFO" name="org.mycontroller.standalone.provider.rflink" />
  <logger level="INFO" name="org.mycontroller.standalone.provider.wunderground" />
  <logger level="INFO" name="org.mycontroller.standalone.restclient" />
  <logger level="INFO" name="org.mycontroller.standalone.rule" />
  <logger level="INFO" name="org.mycontroller.standalone.scheduler" />
  <logger level="INFO" name="org.mycontroller.standalone.scripts" />
  <logger level="INFO" name="org.mycontroller.standalone.settings" />
  <logger level="INFO" name="org.mycontroller.standalone.timer" />
  <logger level="INFO" name="org.mycontroller.standalone.uidtag" />

  <root level="WARN">
    <appender-ref ref="FILE" />
  </root>

<logger name="RAW_MESSAGE_LOGGER" level="DEBUG" additivity="false">
<appender-ref ref="GATEWAY_RAW_MESSAGE_APPENDER"/>
</logger>
</configuration>
But not seeing any extra log file created? Maybe this in the server log is a clue?
13:17:01,556 |-INFO in ch.qos.logback.classic.joran.action.RootLoggerAction - Setting level of ROOT logger to WARN 13:17:01,557 |-INFO in ch.qos.logback.core.joran.action.AppenderRefAction - Attaching appender named [FILE] to Logger[ROOT] 13:17:01,560 |-INFO in ch.qos.logback.classic.joran.action.LoggerAction - Setting level of logger [RAW_MESSAGE_LOGGER] to DEBUG 13:17:01,560 |-INFO in ch.qos.logback.classic.joran.action.LoggerAction - Setting additivity of logger [RAW_MESSAGE_LOGGER] to false 13:17:01,562 |-ERROR in ch.qos.logback.core.joran.action.AppenderRefAction - Could not find an appender named [GATEWAY_RAW_MESSAGE_APPENDER]. Did you define it below instead of above in the configuration file? 13:17:01,562 |-ERROR in ch.qos.logback.core.joran.action.AppenderRefAction - See http://logback.qos.ch/codes.html#appender_order for more details. 13:17:01,562 |-INFO in ch.qos.logback.classic.joran.action.ConfigurationAction - End of configuration. 13:17:01,567 |-INFO in ch.qos.logback.classic.joran.JoranConfigurator@956de9 - Registering current configuration as safe fallback point -
@skywatch In your log file, this part is missing!
Better you can copy the whole file and enable gateway "DEBUG" log
-
@jkandasa Thank you!
It is strange as it is in the zip file and everything was copied across, I cannot imagine how that happened - But all logging well now!
-
You will be happy to know that this issue is now SOLVED!

Since installing the latest SNAPSHOT 1.4.0, all the problems associated with this have gone away. It has all magically gone back to normal.
So no more spikes, dropouts, ghost nodes, or lockups. I am very hopeful again now!
Cheers!
-
See here for reason and solution.....