[SOLVED] Serial problem
-
You will be happy to know that this issue is now SOLVED!
")
Since installing the latest SNAPSHOT 1.4.0, all the problems associated with this have gone away.
Phew, what a little sod this problem has been, but we never gave up and all is well now.
Big thanks!
-
@skywatch Great! nice to hear this.
You may disable gateway(after some days) raw messageDEBUGtoINFO, this log will keep growing. -
@jkandasa After nearly 4 full days without issue I have returned the settings as suggested.
Whilst I am very happy that it is back working again, I guess now we will never know what exactly caused the issue or if it is likely to happen again (to me or others).
For V2.0 you might like to think about a page in the settings area with radio buttons to set the 'INFO' / 'DEBUG' etc parameters. Would be easier, especially for people who are new to linux.
-
NOOOOoooooooooooo..........
Experiencing that the controller was not seemingly getting data reliably from some nodes, I tried to up the GW power from LOW to HIGH. I reflashed the GW last night and set it all back up.
This morning I find the spikes and ghost nodes are all back, along with long periods where node data is not presented on the dashboard.
I have now cleared the GW eeprom and reflashed again with LOW power, just to see what happens. I have rechecked all connections and will see how it goes.
If the issues continue I will re-enable all those DEBUG's and let you know.
-
Now I have USB-serial converter plugged into the pi.
I tested the GW by flashing debug on pro mini and connecting to laptop - all working well and data from sensors seen.
I reflash the GW without debug and connect to the usb-serial and power on pi.
When I access myc I can see the serial GW is up and running. I can see that it has nodes and sensors (maybe inherited from last serial gw?) - But, no data from anything but myagent.
All RF nodes are down. No amount of discover or refresh will show anything. I even deleted a few, but no sign yet that they will re-register.
I even tried swapping Tx/Rx on the usb to serial just in case they printed it wrong.
It made no difference.Is there something I have forgotten to (or didn't know I had to) do?
-
@skywatch Is your gateway up and running in MyController? Can you show your gateway settings in MyController and Gateway Sketch?
-
@jkandasa Sure thing!
GW code is.....
// Enable and select radio type attached
#define MY_RADIO_NRF24
#define MY_RF24_CHANNEL (97)
#define MY_RF24_PA_LEVEL RF24_PA_LOW
#define MY_GATEWAY_SERIAL

#define MY_DEFAULT_LED_BLINK_PERIOD 300

#include <MySensors.h>

void setup()
{
	// Setup locally attached sensors
}

void presentation()
{
	// Present locally attached sensors
}

void loop()
{
	// Send locally attached sensor data here
}
And GW settings in myc are.....
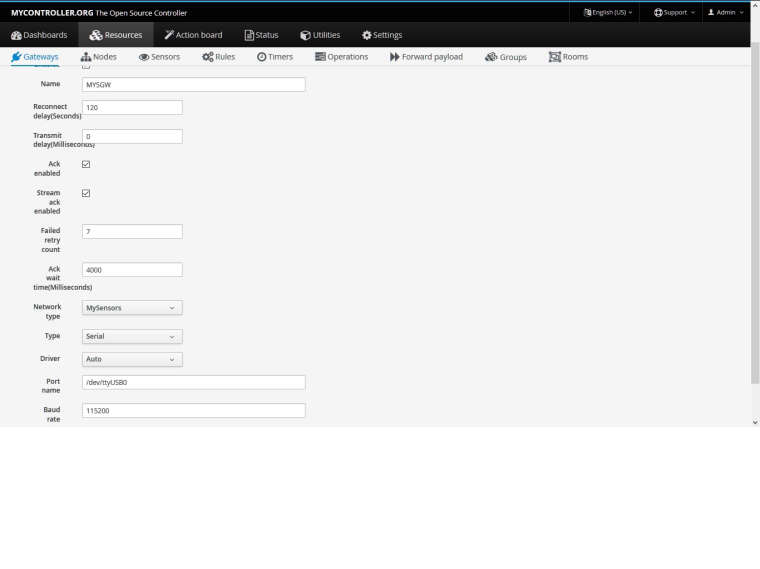
And...
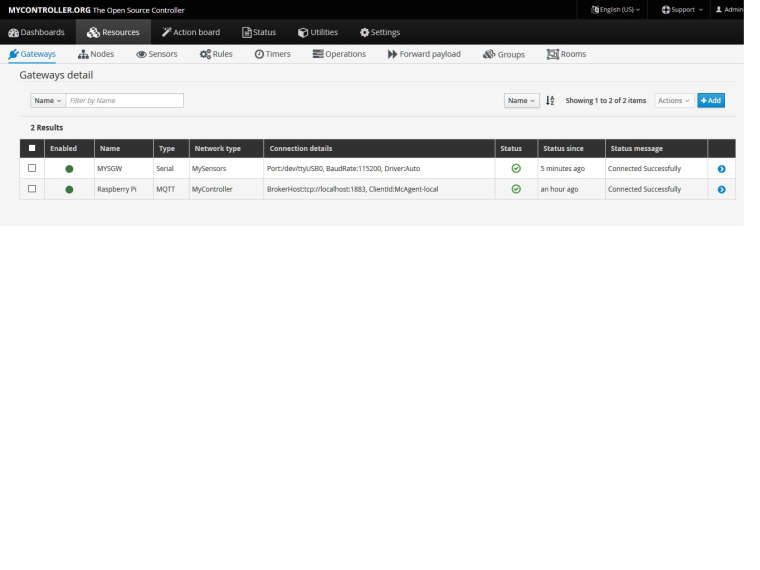
Results in
-
@skywatch All looks good. What about
Node 0(gateway node) status?
Also, runls -lh /dev/ttyUSB*in your RPI.Irevelent to this issue: You may disable
Stream ack enabled, this will speed up your OTA update. -
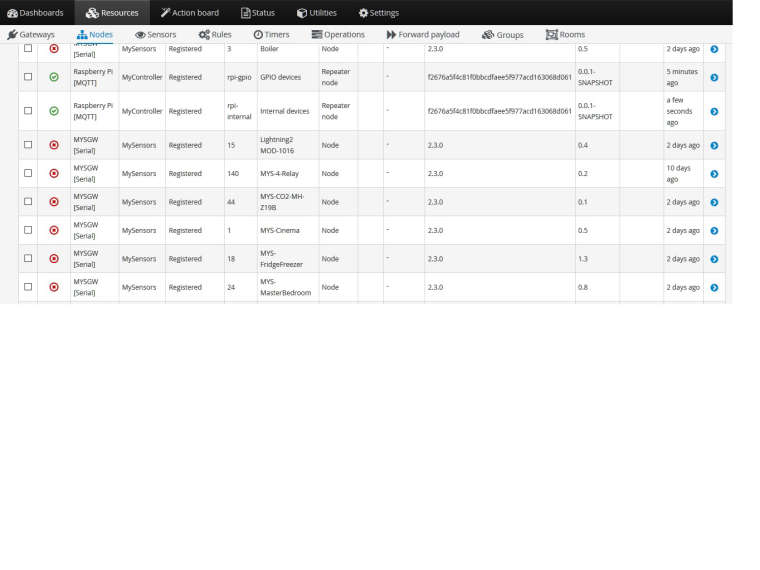
@jkandasa I don't see a node 0 in the nodes page - it is just how you see it above.
Also,
pi@HAMASS:~ $ ls -lh /dev/ttyUSB*
crw-rw---- 1 root dialout 188, 0 Oct 25 08:25 /dev/ttyUSB0
I didn't know what 'Stream ack enabled' was, so I tried enabling it just in case it would help. I have not got as far as ota updates yet.I need a stable system first and then the outdoor nodes will need ota for sure as I remember years ago walking through the snow with a laptop to re-program a node that controlled the heating in the greenhouse (this was with the nrf library and not mysensors).
So then, we seem to need to find out where node 0 went to next?
")
I did manually add a node 0 and it appears in the listing of nodes, but it always shows as 'down'.
-
@skywatch can you check your gateway node output with
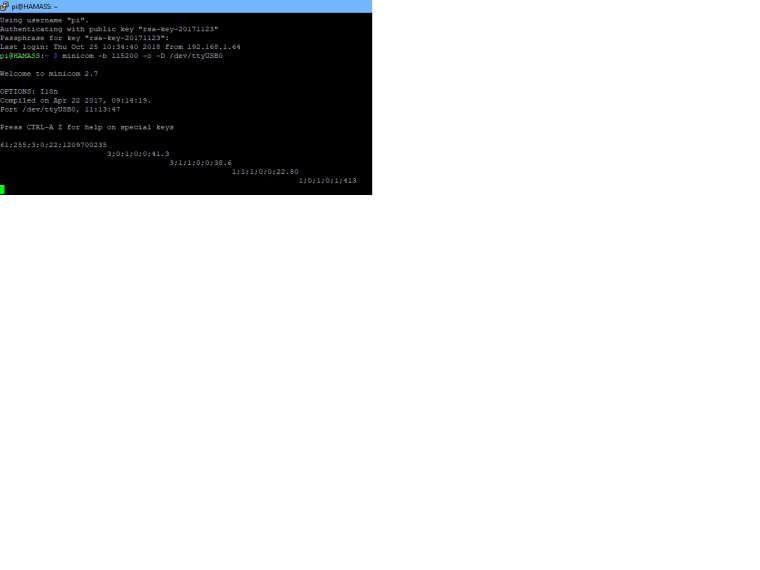
minicom?sudo apt-get install minicom minicom -b 115200 -o -D /dev/ttyUSB0 #You can exit Minicom with Control-A xDisable your gateway in MyController and perform this test.
-
@jkandasa I get this...
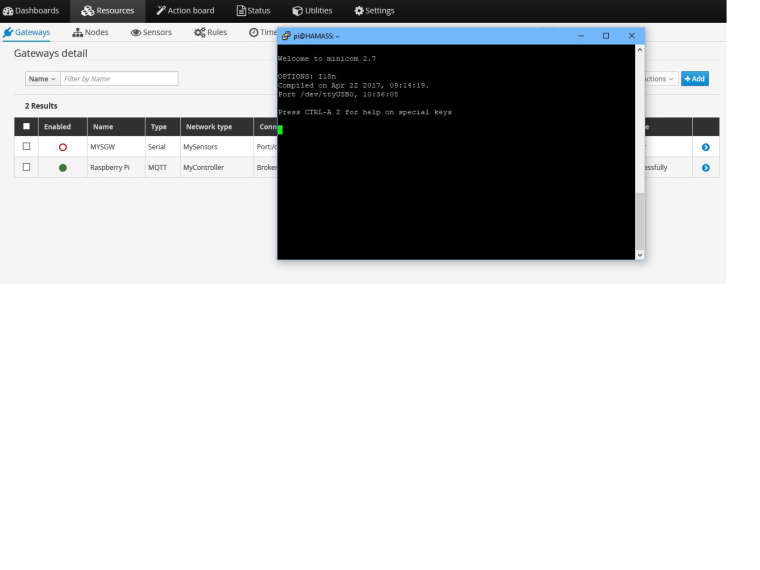
I just tested the GW HW again, it all works when connected to pc via programmer board and mydebug enabled. I reflash with mydebug commented out (only change) and attach it to the serial-usb device and no data seen.I ordered 2 usb-serial modules, just in case, but I get no data from either of them it seems.
I am thinking of a full reinstall now (in a few days), what do you think?
And now I notice this....
Good news is that I now have data from some nodes, will see how it goes.
Bad news is that 3 times in 4 minutes a ghost node (61) has somehow 'registered' itself.I still don't have a node 0 though ?
-
@skywatch can you set up with MyController and check? also, check the mycontroller.log
-
@jkandasa I realise now that node 61 is a real node afterall - Sorry, my fault on that. It was registering but without any sensors. I rebooted the node and all is well with that one now!
Situation is that all nodes except one have now rejoined the myc environment. I still do not see a node0 though. Not sure where it went, but nodes are mostly back working again now.
MYC log shows a lot of errors regarding google analytics, and a list of failed acks at one point only. Here's the google analytics message (appears a lot)....
2018-10-25 12:01:25,398 ERROR [mc-th-pool-8] [org.mycontroller.standalone.api.GoogleAnalyticsApi:375] Exception,
java.lang.RuntimeException: Failed to execute, url:https://www.google-analytics.com/collect, error:Failed to execute, Request:POST https://www.google-analytics.com/collect HTTP/1.1, error:www.google-analytics.com: Name or service not known
	at org.mycontroller.restclient.core.RestHttpClient.doPost(RestHttpClient.java:255)
	at org.mycontroller.restclient.core.RestHttpClient.doPost(RestHttpClient.java:271)
	at org.mycontroller.restclient.core.RestHttpClient.doPost(RestHttpClient.java:283)
	at org.mycontroller.standalone.api.GoogleAnalyticsApi.access$100(GoogleAnalyticsApi.java:59)
	at org.mycontroller.standalone.api.GoogleAnalyticsApi$1.run(GoogleAnalyticsApi.java:373)
	at java.util.concurrent.ThreadPoolExecutor.runWorker(ThreadPoolExecutor.java:1149)
	at java.util.concurrent.ThreadPoolExecutor$Worker.run(ThreadPoolExecutor.java:624)
	at java.lang.Thread.run(Thread.java:748)
I did disable google analytics as you showed previously.
Additionally, I can't get any IR commands to work.....myclog show the following...
2018-10-25 12:29:50,359 ERROR [Acme.Utils.ThreadPool(5)-PooledThread: Acme.Serve.Serve$ServeConnection@7be9f1] [org.mycontroller.standalone.api.jaxrs.exception.mappers.ApplicationExceptionMapper:42] ApplicationException, org.jboss.resteasy.spi.ApplicationException: java.lang.NullPointerException at org.jboss.resteasy.core.MethodInjectorImpl.invoke(MethodInjectorImpl.java:152) at org.jboss.resteasy.core.ResourceMethodInvoker.invokeOnTarget(ResourceMethodInvoker.java:295) at org.jboss.resteasy.core.ResourceMethodInvoker.invoke(ResourceMethodInvoker.java:249) at org.jboss.resteasy.core.ResourceMethodInvoker.invoke(ResourceMethodInvoker.java:236) at org.jboss.resteasy.core.SynchronousDispatcher.invoke(SynchronousDispatcher.java:395) at org.jboss.resteasy.core.SynchronousDispatcher.invoke(SynchronousDispatcher.java:202) at org.jboss.resteasy.plugins.server.servlet.ServletContainerDispatcher.service(ServletContainerDispatcher.java:221) at org.jboss.resteasy.plugins.server.servlet.HttpServletDispatcher.service(HttpServletDispatcher.java:56) at org.jboss.resteasy.plugins.server.tjws.TJWSServletDispatcher.service(TJWSServletDispatcher.java:40) at org.jboss.resteasy.plugins.server.servlet.HttpServletDispatcher.service(HttpServletDispatcher.java:51) at javax.servlet.http.HttpServlet.service(HttpServlet.java:820) at Acme.Serve.Serve$ServeConnection.runServlet(Serve.java:2328) at Acme.Serve.Serve$ServeConnection.parseRequest(Serve.java:2282) at Acme.Serve.Serve$ServeConnection.run(Serve.java:2054) at Acme.Utils$ThreadPool$PooledThread.run(Utils.java:1402) at java.lang.Thread.run(Thread.java:748) Caused by: java.lang.NullPointerException: null at org.mycontroller.standalone.api.jaxrs.SensorHandler.sendPayload(SensorHandler.java:187) at sun.reflect.NativeMethodAccessorImpl.invoke0(Native Method) at sun.reflect.NativeMethodAccessorImpl.invoke(NativeMethodAccessorImpl.java:62) at sun.reflect.DelegatingMethodAccessorImpl.invoke(DelegatingMethodAccessorImpl.java:43) at java.lang.reflect.Method.invoke(Method.java:498) at org.jboss.resteasy.core.MethodInjectorImpl.invoke(MethodInjectorImpl.java:139) ... 15 common frames omitted -
@skywatch Can you check your IR node/sensor variable id exists?
-
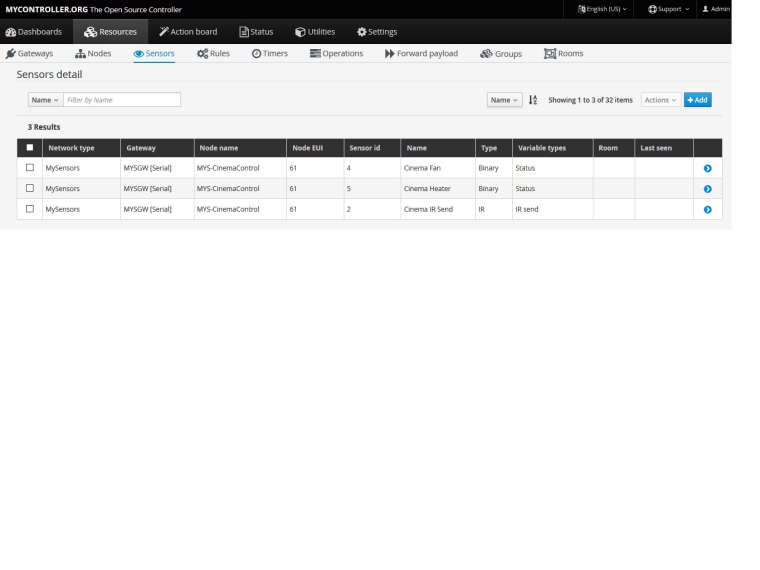
@jkandasa That's interesting - this node (61) registered without seemingly sending it's presentation data as to node, fw version or sensors.
I checked the node-sensors data and the types were missing, so I added them back in.
I now have.....
But still getting error500 when I click on dashboard to send data. This has been working fine for some time now (at least when ack plays nicely it did).UPDATE - I found that on the dashboard buttons page the sensor type was missing.
I added this back in and the error 500 is gone.
It is replaced by error 400 instead now!
MessageImpl(gatewayId=1, nodeEui=61, sensorId=2, type=Set, subType=IR send, ack=1, payload=0x5EA1F807, isTxMessage=true, timestamp=1540480831488, properties=null) 2018-10-25 16:25:36,376 INFO [mc-th-pool-9] [org.mycontroller.standalone.provider.EngineAbstract:246] Seems like failed to send this message. There is no ACK received! Retried 7 time(s). MessageImpl(gatewayId=1, nodeEui=61, sensorId=2, type=Set, subType=IR send, ack=1, payload=0x35357573, isTxMessage=true, timestamp=1540481108074, properties=null) 2018-10-25 16:26:04,669 INFO [mc-th-pool-9] [org.mycontroller.standalone.provider.EngineAbstract:246] Seems like failed to send this message. There is no ACK received! Retried 7 time(s). MessageImpl(gatewayId=1, nodeEui=61, sensorId=2, type=Set, subType=IR send, ack=1, payload=0x35357573, isTxMessage=true, timestamp=1540481136386, properties=null) 2018-10-25 16:27:40,831 INFO [mc-th-pool-9] [org.mycontroller.standalone.provider.EngineAbstract:246] Seems like failed to send this message. There is no ACK received! Retried 7 time(s). MessageImpl(gatewayId=1, nodeEui=61, sensorId=SENSOR_BC, type=Internal, subType=Config, ack=1, payload=M, isTxMessage=true, timestamp=1540481232283, properties=null) 2018-10-25 16:31:04,988 INFO [mc-th-pool-9] [org.mycontroller.standalone.provider.EngineAbstract:246] Seems like failed to send this message. There is no ACK received! Retried 7 time(s). MessageImpl(gatewayId=1, nodeEui=61, sensorId=SENSOR_BC, type=Internal, subType=Config, ack=1, payload=M, isTxMessage=true, timestamp=1540481436518, properties=null) 2018-10-25 16:31:35,195 INFO [mc-th-pool-9] [org.mycontroller.standalone.provider.EngineAbstract:246] Seems like failed to send this message. There is no ACK received! Retried 7 time(s). MessageImpl(gatewayId=1, nodeEui=61, sensorId=2, type=Set, subType=IR send, ack=1, payload=0x5EA1F807, isTxMessage=true, timestamp=1540481466779, properties=null) -
If you're still getting junk data I suggest you take heavy countermeasures against any interference.
First of all, if you have access to an oscilloscope, connect it to the TX and RX lines, see if you can turn the square-ish signal more square with a pull-up (or pull-down between data wire and 5V (or GND), this is a super common issue. There are massive amounts of videos about it online and how it can solve a lot of problems.
Second thing you should definitely do is decouple all power rails, funky power has caused so many issues I can't even count. Attach like ~1mF to RPi's 5V rail, ~1mF to the Pro Mini's 3.3V rail and ~1-5mF electrolytic + ~50uF ceramic directly soldered to the nRF24L01+'s power pins. I'm one of the maintainers on an nRF24 library and a heavy user of these modules it's incredible how many super weird issues just poor wires or power can cause.
-
@avamander Thank you for your suggestions.
Your advice is good and I have already done a lot of what you suggested. I didn't put a scope on it, I may make another portable system and try that then as I do not see any pullups on the pro mini nor on the pi3 schematics. That could well be the centre of my problems.
I also stumbled upon this page ...... https://spellfoundry.com/2016/05/29/configuring-gpio-serial-port-raspbian-jessie-including-pi-3/
This also seems to pinpoint issues with serial on the Raspberry Pi 3B, and why they happen. Seems the foundation made changes that have had a detrimental effect on serial comms stability. It would explain why this happened after 'upgrading' from Pi 2B to Pi 3B. It seems conclusive to me that the issue is with the RPi 3B serial port not working correctly.....Live and learn I guess
Still, for the last 4 days I have been running with a serial to usb adapter and no ghost nodes and no data spikes on the graphs. I wonder if there are pullups on the board? It's difficult to see clearly with the plastic wrapper on it!
Things are looking very hopeful right now though...The only issue I still face is random loss of data from some nodes. The outages can be just one value report missing (Most nodes send data once every 5 minutes), right up to over 6 hours of data loss. Then suddenly it all starts working again. I might have more time now to look into that a bit morenow the system is stable again, but it is so random.
I did also find quite a few 'less than good' dupont cables (from China) - So I have soldered directly a lot of connections now or modified/re-crimped the cables that were 'iffy'.
Thanks again to you and Jkandasa for the support and help. I am nearly there with this now and can build some more nodes with confidence.