• Categories
  • Recent
  • Tags
  • Popular
  • Register
  • Login
  • Categories
  • Recent
  • Tags
  • Popular
  • Register
  • Login

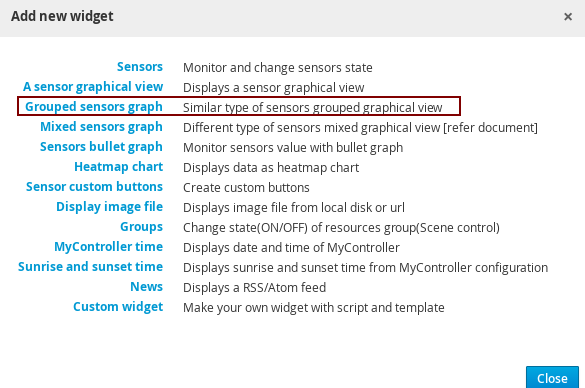
Grouped sensors graph

Scheduled Pinned Locked Moved Dashboard
14 Posts 2 Posters 5.8k Views 1 Watching
Loading More Posts
  • Oldest to Newest
  • Newest to Oldest
  • Most Votes
Reply
  • Reply as topic
Log in to reply
This topic has been deleted. Only users with topic management privileges can see it.
  • T Offline
    Tetnobic
    last edited by 12 Jan 2017, 13:24

    Hi, is there a way to show more than one graph in the same widget at the same time, for exemple show graph for sensor temp1 and sensor temp2 ?

    Thanks

    J 1 Reply Last reply 12 Jan 2017, 17:05 Reply Quote 0
    • J Offline
      jkandasa @Tetnobic
      last edited by 12 Jan 2017, 17:05

      @Tetnobic There is a dashboard widget is,

      Grouped sensor graph

      0_1484240706909_upload-d21cbe47-fc22-4cfc-8c0f-7a8d67db3be0

      T 1 Reply Last reply 12 Jan 2017, 17:37 Reply Quote 0
      • T Offline
        Tetnobic @jkandasa
        last edited by 12 Jan 2017, 17:37

        @jkandasa Thanks for your response,
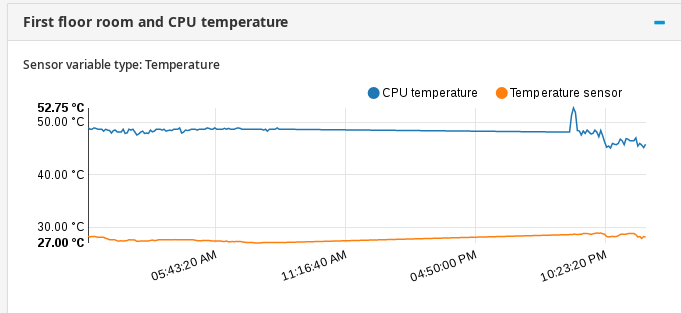
        but with this widget, I only have one line for 2 differents temperature sensor....
        This : 0_1484242511785_Sans titre.png

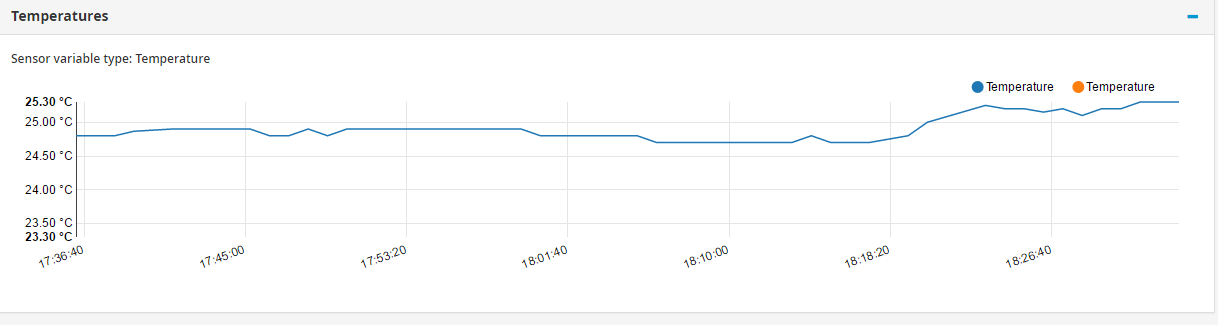
        Only blue line is show
        If I click on temperature bubble :
        0_1484242635384_Sans titre2.png

        Only orange line

        Can I have blue and orange at the same time ??

        Thanks

        J 1 Reply Last reply 12 Jan 2017, 18:37 Reply Quote 0
        • J Offline
          jkandasa @Tetnobic
          last edited by 12 Jan 2017, 18:37

          @Tetnobic Both graph should show, For some reason, it is not showing for you. Do you see any error on browser console?

          Which browser are you using? I tested it on Google chrome and it works.

          0_1484246223447_upload-9c559fbd-2bbf-42f8-b81c-87aa0074b614

          T 1 Reply Last reply 13 Jan 2017, 09:51 Reply Quote 0
          • T Offline
            Tetnobic @jkandasa
            last edited by 13 Jan 2017, 09:51

            @jkandasa No error on browser console, I use Google Chrome too
            I supposed it's because the values of the 2 temperature sensor are always nears...
            In graph point overlay, I have this : 0_1484300585126_Sans titre3.png

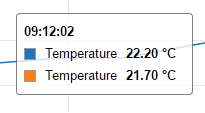
            But with more difference,
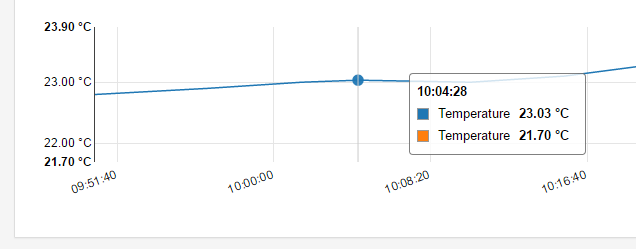
            0_1484300958192_Sans titre4.png

            No Orange graph 😞

            J 1 Reply Last reply 14 Jan 2017, 01:09 Reply Quote 0
            • J Offline
              jkandasa @Tetnobic
              last edited by 14 Jan 2017, 01:09

              @Tetnobic I guess it is because of the name. Can you change any one sensor name on MC GUI?

              T 1 Reply Last reply 16 Jan 2017, 09:41 Reply Quote 0
              • T Offline
                Tetnobic @jkandasa
                last edited by 16 Jan 2017, 09:41

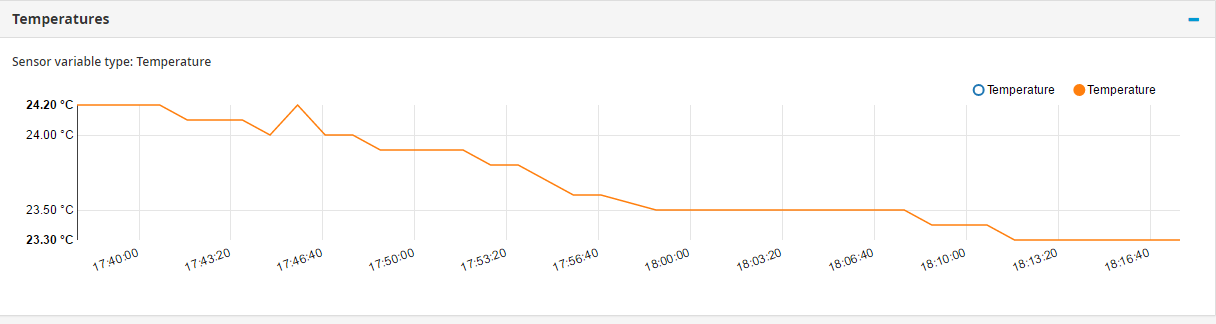
                @jkandasa oh oh indeed when I change Sensor Name (from "Temperature" to "Temperature2") :
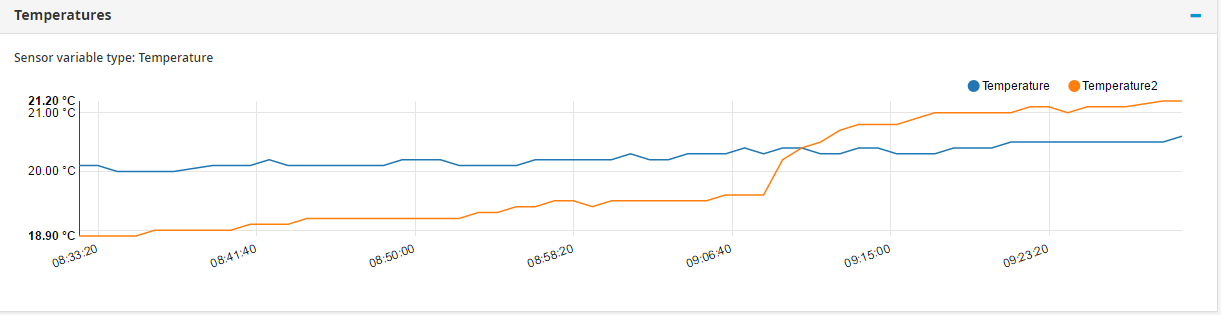
                0_1484555653494_Sans titre5.png
                it works !!!!
                But a bit annoying because all my node use exactly the same code ("sketch")...., so the same :
                ....
                present(NODE_CHILD_ID_TEMP, S_TEMP, "Temperature", false);
                .....

                J 1 Reply Last reply 16 Jan 2017, 14:50 Reply Quote 0
                • J Offline
                  jkandasa @Tetnobic
                  last edited by 16 Jan 2017, 14:50

                  @Tetnobic Fine, I will address this by adding some unique id.Kindly create ticket for this on https://github.com/mycontroller-org/mycontroller/issues

                  Thank you!

                  T 1 Reply Last reply 16 Jan 2017, 14:57 Reply Quote 0
                  • T Offline
                    Tetnobic @jkandasa
                    last edited by Tetnobic 16 Jan 2017, 14:57

                    @jkandasa Ticket created !
                    Many thanks to you for spend time on our problems 👍

                    J 2 Replies Last reply 17 Jan 2017, 10:40 Reply Quote 1
                    • J Offline
                      jkandasa @Tetnobic
                      last edited by 17 Jan 2017, 10:40

                      @Tetnobic This ticket resolved. You can check this on our latest SNAPSHOT version.

                      1 Reply Last reply Reply Quote 1
                      • J Offline
                        jkandasa @Tetnobic
                        last edited by 26 Jan 2017, 17:40

                        @Tetnobic Changed this feature bit different. You have to enable Enable unique name checkbox to get unique chart name.
                        image

                        T 1 Reply Last reply 7 Feb 2017, 15:52 Reply Quote 1
                        • T Offline
                          Tetnobic @jkandasa
                          last edited by 7 Feb 2017, 15:52

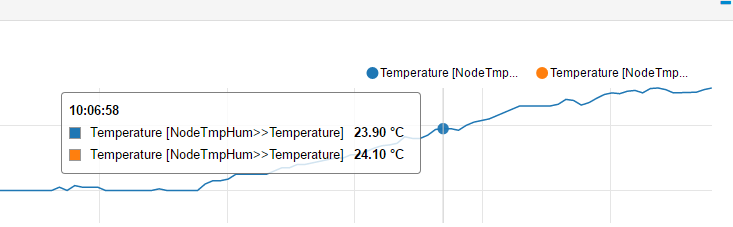
                          @jkandasa Unfortunately, I just tried the latest build with this feature, and it does not work for me,
                          my sensors and nodes have exactly the same name (It's the same source code)..... 😞
                          0_1486482722063_capture1.png

                          J 1 Reply Last reply 7 Feb 2017, 17:53 Reply Quote 0
                          • J Offline
                            jkandasa @Tetnobic
                            last edited by 7 Feb 2017, 17:53

                            @Tetnobic Thanks to reporting this issue. This is fixed and pushed changes on SNAPSHOT version. Kindly clear your cache and test with latest SNAPSHOT version.

                            Thank you!

                            T 1 Reply Last reply 8 Feb 2017, 09:31 Reply Quote 1
                            • T Offline
                              Tetnobic @jkandasa
                              last edited by Tetnobic 2 Aug 2017, 15:01 8 Feb 2017, 09:31

                              @jkandasa I test the latest SNAPSHOT and it works like a charm !!!
                              Thanks a lot 👍

                              1 Reply Last reply Reply Quote 1
                              • First post
                                Last post

                              0

                              Online

                              619

                              Users

                              531

                              Topics

                              3.4k

                              Posts
                              Copyright © 2015-2025 MyController.org | Contributors | Localization