how to display Custom type sensor / Variable value in a graph
-
Hi all,
I have setup a mysensors network in my house and garden and its working rather well now. Among others, I have several DHP sensors sending temperature and humidity and I can display them quite well on the dashboard on grouped graphes.
As I want to compare the absolute humidity in different areas, I created in the local node Arduino scripts a function, that calculates an estimation of absolut humidity, which is then send as Custom sensor and Variable 1 to the controller. Mycontroller does receive them and I can see the values individually on the different ressource pages and also as value on the dashboard.
But I can't get this value being displayed in a graph (like temperature and relative humidity). When I generate a new graph, the sensors just do not show as posibility to select for a grouped sensor graph.
Any hint where I can find a solution?
I thank you in advance !
Denis
-
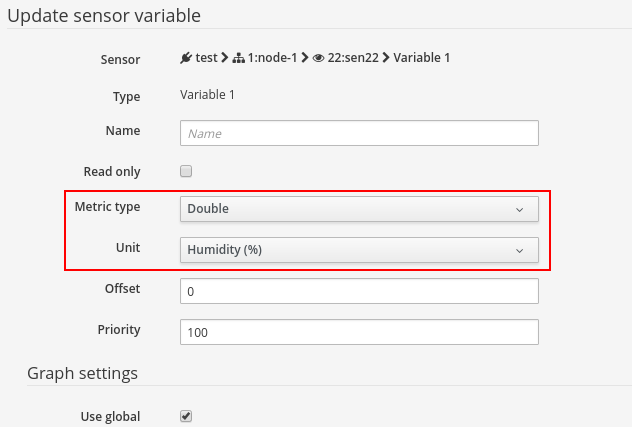
@dr_pub You can change the sensor variable metric type and will be displayed on a single graph. But for now, it is not possible to show it on grouped sensors graph when we use custom type. For this, you may use some other defined type, if you want to display on grouped sensor graph.
-
thank you very much. it worked like you said. but as I need grouped graphs, I probably will (mis-)use the moisture variable type, so that I enter into the standard variables of mysensors.
thanks again !