Long Running Dashboard Blows Up In Chrome

-
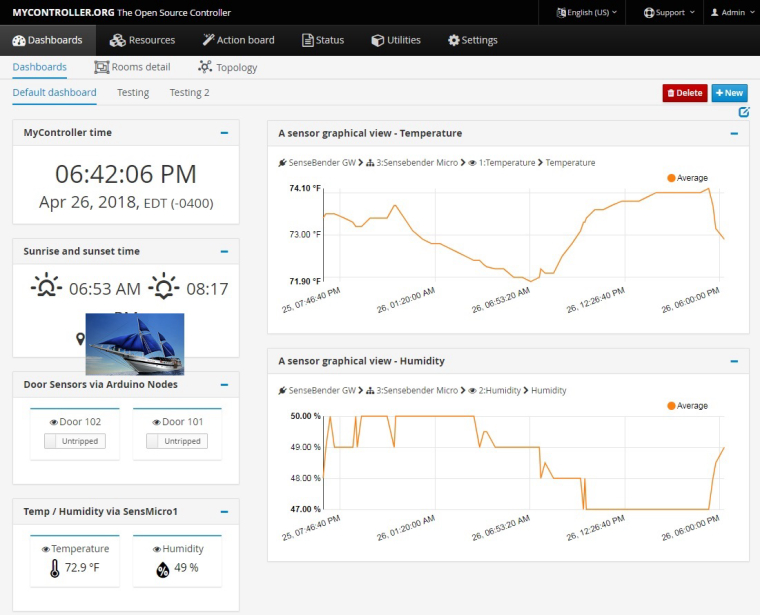
I mostly use Chrome. My dashboard is the default with a few widgets added. A few sensor values, and temp and humidity graphs. After a while (or even in just 5 minutes sometimes) the page blows up with an "oh snap" error. I was able to capture a memory profile over one minute on the page, and saved it to a file. I don't know how to use it but maybe it will be helpful. My impression is that there's a memory leak. But I don't know how to tell if it's Chrome, the page, or something else.
The memory profile is over 200MB so can't upload it here. But if you think it would help you can get it from this shared link memory profile snapshot
Chrome: Version 65.0.3325.181 (Official Build) (64-bit)
MyController: mycontroller-dist-standalone-1.3.0-SNAPSHOT-single.jar
MyController running on Ubuntu 14.04LTS (I think)
Java: VM version 1.8.0_161-b12
Chrome runs on Windows 7 Professional 64bitVery repeatable. Just need to keep the dashboard open. Same thing happens when I keep the page open on my work computer.
Thanks!!!!! --D
-
@dklinkman similar issue: https://github.com/mycontroller-org/mycontroller/issues/393
I will try to find the root cause. Thanks for reporting this. -
@jkandasa Thanks for the cross-reference. Glad it isn't just me.
So far I only see this on the dashboard. I've had other pages open in a tab for days with no issue that I noticed. But my PC has 16GB ram too. So maybe just more headroom. I will try to observe other pages that update, like under Resources, and monitor memory. I will let you know if I see anything interesting.
If I can do any other specific diagnostics please let me know. Happy to do it.
Thanks for looking!!!! --D
-
If I can do any other specific diagnostics please let me know. Happy to do it.
Sure, thank you for your help!